
MACROECONOMICS-ACCESS
10th Edition
ISBN: 9781259662553
Author: Colander
Publisher: MCG
expand_more
expand_more
format_list_bulleted
Concept explainers
Question
Chapter 2, Problem 1QE
To determine
The shift of the
Expert Solution & Answer
Explanation of Solution
The figure shows the production possibility curve.
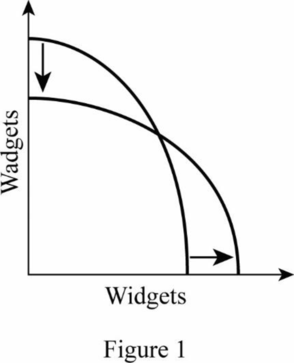
In the figure, the horizontal axis represents the production of widgets and the vertical axis represents production of wadgets. As a result of an increase in the production of widgets, the point that touches the X-axis will move rightward. If the production of wadgets decreases, the point that touches the Y-axis moves downward. This will create a new production possibility curve.
Economics Concept Introduction
Production possibility curve: Production possibility curve refers to the different combinations of two commodities that can be produced using the available resources and technologies fully and efficiently.
Want to see more full solutions like this?
Subscribe now to access step-by-step solutions to millions of textbook problems written by subject matter experts!
Students have asked these similar questions
What are the properties of the production possibility curve
Which situation would most likely cause a nation & production possibilities curve to shift inward? The construction of more capital goods
An increase in discrimination based on race
An increase in the number of skilled immigrant workers
The destruction from bombing and warfare in a losing military conflict
What ways that a country could shift its production possibilities curve to the right through improved technology.
Chapter 2 Solutions
MACROECONOMICS-ACCESS
Ch. 2.1 - Prob. 1QCh. 2.1 - Prob. 2QCh. 2.1 - Prob. 3QCh. 2.1 - Prob. 4QCh. 2.1 - Prob. 5QCh. 2.1 - Prob. 6QCh. 2.1 - Prob. 7QCh. 2.1 - Prob. 8QCh. 2.1 - Prob. 9QCh. 2.1 - Prob. 10Q
Ch. 2.A - Prob. 1QECh. 2.A - Prob. 2QECh. 2.A - Prob. 3QECh. 2.A - Prob. 4QECh. 2.A - Prob. 5QECh. 2.A - Prob. 6QECh. 2.A - Prob. 7QECh. 2.A - Prob. 8QECh. 2 - Prob. 1QECh. 2 - Prob. 2QECh. 2 - Prob. 3QECh. 2 - Prob. 4QECh. 2 - Prob. 5QECh. 2 - Prob. 6QECh. 2 - Prob. 7QECh. 2 - Prob. 8QECh. 2 - Prob. 9QECh. 2 - Prob. 10QECh. 2 - Prob. 11QECh. 2 - Prob. 12QECh. 2 - Prob. 1QAPCh. 2 - Prob. 2QAPCh. 2 - Prob. 3QAPCh. 2 - Prob. 4QAPCh. 2 - Prob. 5QAPCh. 2 - Prob. 1IPCh. 2 - Prob. 2IPCh. 2 - Prob. 3IPCh. 2 - Prob. 4IPCh. 2 - Prob. 5IPCh. 2 - Prob. 6IP
Knowledge Booster


Learn more about
Need a deep-dive on the concept behind this application? Look no further. Learn more about this topic, economics and related others by exploring similar questions and additional content below.Similar questions
- Explain how (if at all) each of the following events affects the location of a country’s production possibilities curve: A new technique improves the efficiency of extracting copper from ore.arrow_forwardIf there is trade, which of the following is most likely? A. A country’s consumption possibilities frontier can be outside its production possibilities frontier. B. A country will produce a greater variety of goods and services to trade. C. A country is worse off because it becomes dependent on other countries. D. A country will experience a lower unemployment rate.arrow_forwardUnder the assumption of the PPF, exonomic growth can be represented by which of the following: A. An i ward shift of the production possibility frontier B. A movement along the production possibility frontier C. An outward shift of the production possibility frontier D. A decission by the government to produce inside the production possibility frontierarrow_forward
- Why is the production possibility curve also called as the opportunity cost curvearrow_forwardWhat is a production possibility curve and explain points of efficiency, inefficiency, and not attainable.arrow_forwardIf the production possibilities frontier curve is linear and downward-sloping instead of bowed out, that indicatesarrow_forward
- Explain how (if at all) each of the following events affects the location of a country’s production possibilities curve: The quality of education increases.arrow_forwardHow could a country shift its production possibilities curve to the right through improved technology?arrow_forwardImagine two societies A and B with the production possibility curve shown in the diagram. In year t Society A produces only capital goods and Society B only butter In year t + 1 they both produce only butter. Which of the following describes both societies in year t + 1? A) A has a larger capital stock and A produces more butter. B) Both have the same capital stock but A produces more butter. C) Both have the same capital stock and both produce the same amount of butter. D) A has a larger capital stock but B produces more butter.arrow_forward
- A producer has a comparative advantage in a good if it is the lowest opportunity cost producer of this good, even if it is not the most efficient producer of this good. True Falsearrow_forwardWhich of the following results in an outward shift in the Production Possibility Frontier? * Diversity in consumer preferences Reduction in prices Improvements in technology All of the abovearrow_forward
arrow_back_ios
arrow_forward_ios
Recommended textbooks for you


 Economics (MindTap Course List)EconomicsISBN:9781337617383Author:Roger A. ArnoldPublisher:Cengage Learning


Economics (MindTap Course List)
Economics
ISBN:9781337617383
Author:Roger A. Arnold
Publisher:Cengage Learning