
(a)
Identify the role of scarcity on
(a)
Explanation of Solution
Figure 1 illustrates the PPF of Company B.
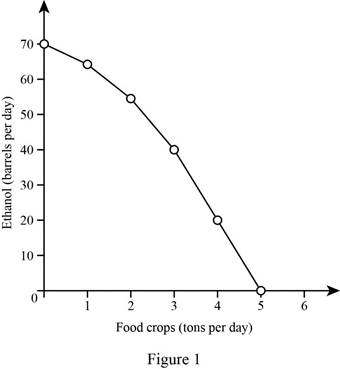
In Figure 1, the x-axis shows food crops and the y-axis shows ethanol. The PPF shows the production combinations of ethanol and food crops. The production combinations of these commodities lie beyond the PPF and are not attainable with the given resources; this indicates the concept of scarcity. The movement along the PPF also indicates scarcity because when one good produces more, other goods are reduced.
Scarcity: Scarcity refers to the limited availability of resources than the required level.
Production possibility frontier: Production possibility frontier shows the boundary between the combination of two goods and services that can produced at the given level of resources.
(b)
Identify the concept of production efficiency.
(b)
Explanation of Solution
A production possibility frontier shows the combination of two commodities that can be produced at the given level of resources. Therefore, the combinations of commodities that lie along the PPF indicate efficient production levels. In this case, if Company B produces 40 barrels of ethanol per day, then the production of food per day needed to achieve the production efficiency will be 3 tons.
Efficient production: Efficient production shows the combinations of two commodities that lie along the PPF.
(c)
Identify the concept of tradeoff in a PPF.
(c)
Explanation of Solution
A movement along the PPF curve explains that producing more of one good leads to producing less of another good. Therefore, there is a tradeoff that exists between the commodities; it is also noted that this type of tradeoff exists only at an efficient production level. In this case, Company B has limited resources and technology. Therefore, an increase in the production of one good decreases the production of the other good. As a result, Company B will face a tradeoff on its PPF.
Production possibility frontier: Production possibility frontier shows the boundary between the combination of two goods and services that can be produced at the given level of resources.
Want to see more full solutions like this?
Chapter 2 Solutions
EBK MACROECONOMICS

- Comparative and absolute advantage Elijah and Aneesha are farmers. Each one owns an 18-acre plot of land. The following table shows the amount of squash and maize each farmer can produce per year on a given acre. Each farmer chooses whether to devote all acres to producing squash or maize or to produce squash on some of the land and maize on the rest. Squash Maize (Pounds per acre) (Pounds per acre) Elijah 12 3 Aneesha 18 6 On the following graph, use the blue line (circle symbol) to plot Elijah's production possibilities frontier (PPF), and use the purple line (diamond symbol) to plot Aneesha's PPF. Elijah's PPF Aneesha's PPF 0 90 180 270 360 450 540 630 720 810 900 180 162 144 Note:- Do not provide handwritten solution. Maintain accuracy and quality in your answer. Take care of plagiarism. Answer completely. You will get up vote for sure.arrow_forward5. Comparative and absolute advantage Kevin and Maria are farmers. Each one owns a 20-acre plot of land. The following table shows the amount of corn and rye each farmer can produce per year on a given acre. Each farmer chooses whether to devote all acres to producing corn or rye or to produce corn on some of the land and rye on the rest. Corn Rye (Bushels per acre) (Bushels per acre) Kevin 40 Maria 28 7 On the following graph, use the blue line (circle symbol) to plot Kevin's production possibilities curve (PPF), and use the purple line (diamond symbol) to plot Maria's PPF. 200 180 Kevin's PPF 160 140 * 120 Maria's PPFarrow_forwardThe following table shows the amount of good A and good B that two countries could produce if they devoted all their resources to that good. Assume both countries have the same quantity of resources and the trade-off between good A and good B remains constant as resources are shifted from one good to another. Answer the questions below and show calculations where appropriate. Canada India Good A 600 500 Good B 950 1200 Draw a straight-line PPF graph for Canada. Draw a straight-line PPF graph for India. Which country has the comparative advantage in good A? In good B? Explain. What is India’s marginal opportunity cost of producing good A? Good B? Based on the data given, what is the terms of trade range for good A in terms of units of good B?arrow_forward
- Use the following information to work Problems 1 to 3. Brazil produces ethanol from sugar, and the land used to grow sugar can be used to grow food crops. Suppose that Brazil's production possibilities for ethanol and food crops are as follows Ethanol (barrels per day) 70 64 54 40 22 0 and and and and and and Food crops (tons per day) 0 1 2 1. a. Draw a graph of Brazil's PPF and explain how your graph illustrates scarcity. b. If Brazil produces 40 barrels of ethanol a day, how much food must it produce to achieve production efficiency? c. Why does Brazil face a tradeoff on its PPF? 2. a. If Brazil increases its production of ethanol from 40 barrels per day to 54 barrels per day, what is the opportunity cost of the additional ethanol? b. If Brazil increases its production of food crops from 2 tons per day to 3 tons per day, what is the opportunity cost of the additional food? c. What is the relationship between your answers to parts (a) and (b)? 3. Does Brazil face an increasing…arrow_forward个 The table shows Frigidia's production possibilities. Fish (pounds per month) 300 200 100 0 Draw the four points defined in the table. Use the four-point line tool to draw the PPF. Label it. and and and and Skis (pairs per month) 0 50 100 150 If Frigidia produces 200 pounds of fish per month, how many pairs of skis must it produce to achieve production efficiency? Frigidia must produce pairs of skis to achieve production efficiency. What is Frigidia's opportunity cost of producing 1 pound of fish and 1 pair of skis? pairs of The opportunity cost of 1 pound of fish is skis 300- 250 200- Fish (pounds per month) 150- 100- 50- 25 50 75 100 125 Skis (pairs per month) 150 17!arrow_forwardR Imagine that it costs $40 in the United States to produce one ton of soybeans and transport them to market, while it costs $30 in Brazil to produce one ton of soybeans and transport them to market Imagine that it costs $20,000 in the United States to produce one automobile and transport it to maket, while costs $10,000 in Brazil to produce one automobile and transport it to market. Which of the following four arrangements would be most efficient? (Hint: Derived OC from PPF (production) = 1/OC derived from costs to make ) a. The United States should produce everything, since it can produce both soybeans and automobiles better than Brazil can produce them. Ob. Brazil should specialize and produce only automobiles. The United States should specialize and produce only soybeans. Then the two countries should trade with each other. Brazil will send automobiles to the United States, while the United States sends soybeans to the Brazil. Oc. The United States should specialize and produce…arrow_forward
- Points on Production Possibilities Frontier Canada China Wheat Computers Wheat Computers A 150 0 90 0 B 100 25 60 60 C 50 50 30 120 D 0 75 0 180 Draw the production possibilities graph for Canada and China and label all of the points on the graph. For which good does Canada have a comparative advantage? For which good does China have a comparative advantage? If Canada and China decide to specialize and trade, how many more computers and bushels of wheat would be available for consumption by both countries? Show the increase on your graphs. Canada and China decide to impose trade restrictions in the form of a tariff on the computers and wheat. What are the costs or benefits to the consumer, producer and government for each country?arrow_forward2. Comparative and absolute advantage Gilberto and Juanita are farmers. Each one owns a 12-acre plot of land. The following table shows the amount of rye and corn each farmer can produce per year on a given acre. Each farmer chooses whether to devote all acres to producing rye or corn or to produce rye on some of the land and com on the rest. Rye Corn (Bushels per acre) (Bushels per acre) Gilberto 12 Juanita 18 On the following graph, use the blue line (circle symbol) to plot Gilberto's production possibilities frontier (PPF), and use the purple line (diamond symbol) to plot Juanita's PPF. 120 108 Gilberto's PPF 96 84 72 Juanita's PPF 60 48 36 24 12 60 120 180 240 300 360 420 480 540 600 RYE (Bushels) - has an absolute advantage in the production of rye, and v has an absolute advantage in the production of corn. Gilberto's opportunity cost of producing 1 bushel of corn is bushels of rye, whereas Juanita's opportunity cost of producing 1 bushel of corn is bushels of rye. Because…arrow_forwardComparative and absolute advantage Antonio and Caroline are farmers. Each one owns a 20-acre plot of land. The following table shows the amount of alfalfa and barley each farmer can produce per year on a given acre. Each farmer chooses whether to devote all acres to producing alfalfa or barley or to produce alfalfa on some of the land and barley on the rest. Alfalfa Barley (Bushels per acre) (Bushels per acre) Antonio 40 8 Caroline 28 7 On the following graph, use the blue line (circle symbol) to plot Antonio's production possibilities frontier (PPF), and use the purple line (diamond symbol) to plot Caroline's PPF. Antonio's PPFCaroline's PPF01002003004005006007008009001000200180160140120100806040200BARLEY (Bushels)ALFALFA (Bushels) _______ has an absolute advantage in the production of alfalfa, and ______ has an absolute advantage in the production of barley. Antonio's opportunity cost of producing 1 bushel of barley is…arrow_forward
- 9. The following data show the combinations of output of cars and computers. Combination Computers 3000 2200 Cars 600 2000 700 D 1000 900 E 1000 a) Draw a production possibilities frontier (PPF) for computers and cars output. Keep the cars on X-axis. (Graph should be properly labelled) b) Briefly explain why it most likely has a bowed-out shape. Show a point of output that is certainly impossible for the society to achieve. Show a point on production possibility frontier that is achievable but inefficient. d) Show graphically the impact on PPF of technology advancement in the form of assembly line of cars production (Graph should be properly labelled) Show graphically the impact on PPF of the newly discovered input used inputs for both cars e) and computers.arrow_forward. Country A and Country B are two countries that each produce t-shirts (T) and sneakers (S). From its available resources and technology Country A can produce 100 t-shirts and 0 sneakers or 0 t- shirts and 200 sneakers or any combination of t-shirts and sneakers that sits on Country A's linear PPF. From its available resources and technology Country B can produce 50 t-shirts and 0 sneaker or 0 t-shirt and 50 sneakers or any combination of t-shirts and sneakers that sits on Country B's linear PPF. a. On two separate graphs draw the PPF for Country A and Country B. Measure t-shirts on the vertical axis and sneakers on the horizontal axis.arrow_forward. Country A and Country B are two countries that each produce t-shirts (T) and sneakers (S). From its available resources and technology Country A can produce 100 t-shirts and 0 sneakers or 0 t- shirts and 200 sneakers or any combination of t-shirts and sneakers that sits on Country A's linear PPF. From its available resources and technology Country B can produce 50 t-shirts and 0 sneaker or 0 t-shirt and 50 sneakers or any combination of t-shirts and sneakers that sits on Country B's linear PPF. b. Write an equation in slope-intercept form for the PPF for Country A.arrow_forward
