Concept explainers
Videos
The following tables show the first-round winning scores of the NCAA men's and women's basketball teams.
TABLE 2-17 Men's Winning First-Round NCAA Tournament Scores
| 95 | 70 | 79 | 99 | 83 | 72 | 79 | 101 |
| 69 | 82 | 86 | 70 | 79 | 69 | 69 | 70 |
| 95 | 70 | 77 | 61 | 69 | 68 | 69 | 72 |
| 89 | 66 | 84 | 77 | 50 | 83 | 63 | 58 |
TABLE 2-18 Women's Winning First-Round NCAA Tournament Scores
| 80 | 68 | 51 | 80 | 83 | 75 | 77 | 100 |
| 96 | 68 | 89 | 80 | 67 | 84 | 76 | 70 |
| 98 | 81 | 79 | 89 | 98 | 83 | 72 | 100 |
| 101 | 83 | 66 | 76 | 77 | 84 | 71 | 77 |
Use the software or method of your choice to construct separate histograms for the men's and women's winning scores Try 5, 7, and 10 classes for each. Which number of classes seems to be the best choice? Why?
To graph: The histogram for men’s and women’s winning score data..
Explanation of Solution
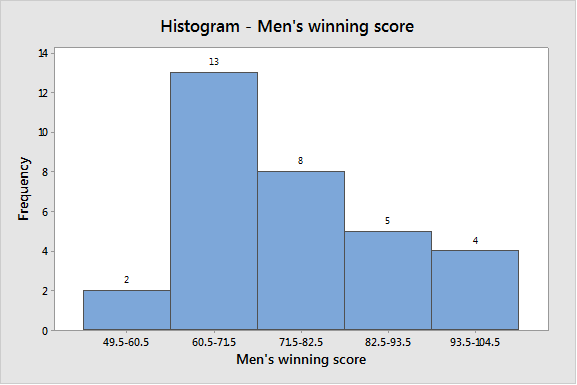
Calculation: For Men’s winning score data:
The largest value of the data set is 101 and the smallest value is 50 in the men’s winning score data.
Using five classes, the class width is calculated in the following way:
The frequency table is as follows:
| Class-limits | Class boundaries | Frequency |
| 50–60 | 49.5–60.5 | 2 |
| 61–71 | 60.5–71.5 | 13 |
| 72–82 | 71.5–82.5 | 8 |
| 83–93 | 82.5–93.5 | 5 |
| 94–104 | 93.5–104.5 | 4 |
To construct the histogram by using the MINITAB, the steps are as follows:
Step 1: Enter the class boundaries in C1 and frequency in C2.
Step 2: Go to Graph > Histogram > Simple.
Step 3: Enter C1 in Graph variable, then go to Data options > Frequency > C2.
Step 4: Click on OK.
The obtained histogram is
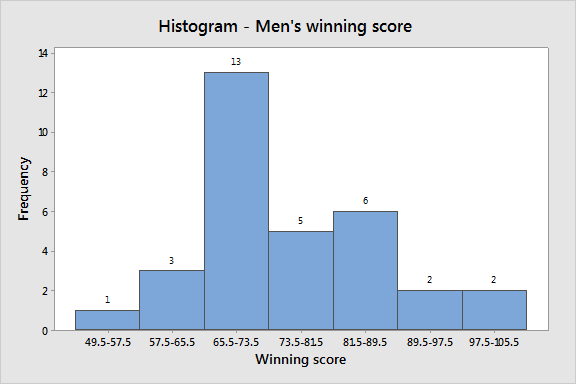
Using seven classes, the class width is calculated in the following way:
| Class-limits | Class boundaries | Frequency |
| 50–57 | 49.5–57.5 | 1 |
| 58–65 | 57.5–65.5 | 3 |
| 66–73 | 65.5–73.5 | 13 |
| 74–81 | 73.5–81.5 | 5 |
| 82–89 | 81.5–89.5 | 6 |
| 90–97 | 89.5–97.5 | 2 |
| 98–105 | 97.5–10.5 | 2 |
To construct the histogram by using the MINITAB, the steps are as follows:
Step 1: Enter the class boundaries in C3 and frequency in C4.
Step 2: Go to Graph > Histogram > Simple.
Step 3: Enter C3 in Graph variable, then go to Data options > Frequency > C4.
Step 4: Click on OK.
The obtained histogram is
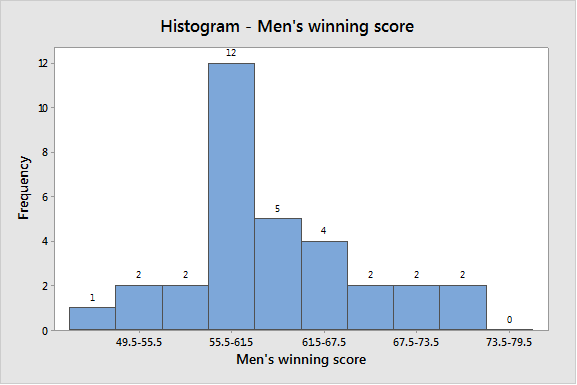
Using 10 classes, the class width is calculated in the following way:
| Class-limits | Class boundaries | Frequency |
| 50–55 | 49.5–55.5 | 1 |
| 56–61 | 55.5–61.5 | 2 |
| 62–67 | 61.5–67.5 | 2 |
| 68–73 | 67.5–73.5 | 12 |
| 74–79 | 73.5–79.5 | 5 |
| 80–85 | 79.5–85.5 | 4 |
| 86–91 | 85.5–91.5 | 2 |
| 92–97 | 91.5–97.5 | 2 |
| 98–103 | 97.5–103.5 | 2 |
| 104–109 | 103.5–109.5 | 0 |
To construct the histogram by using the MINITAB, the steps are as follows:
Step 1: Enter the class boundaries in C5 and frequency in C6.
Step 2: Go to Graph > Histogram > Simple.
Step 3: Enter C5 in Graph variable, then go to Data options > Frequency > C6.
Step 4: Click on OK.
The obtained histogram is
For Women’s winning score data:
The largest value of the data set is 101 and the smallest value is 51 in the women’s winning score data.
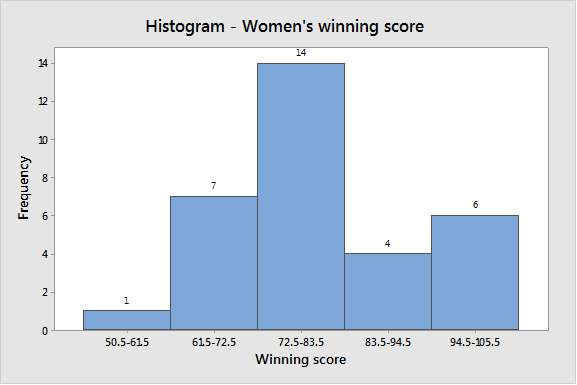
Using five classes, the class width calculated in the following way:
The frequency table is as follows:
| Class-limits | Class boundaries | Frequency |
| 51–61 | 50.5–61.5 | 1 |
| 62–72 | 61.5–72.5 | 7 |
| 73–83 | 72.5–83.5 | 14 |
| 84–94 | 83.5–94.5 | 4 |
| 95–105 | 94.5–105.5 | 6 |
To construct the histogram by using the MINITAB, the steps are as follows:
Step 1: Enter the class boundaries in C7 and frequency in C8.
Step 2: Go to Graph > Histogram > Simple.
Step 3: Enter C8 in Graph variable, then go to Data options > Frequency > C8.
Step 4: Click on OK.
The obtained histogram is
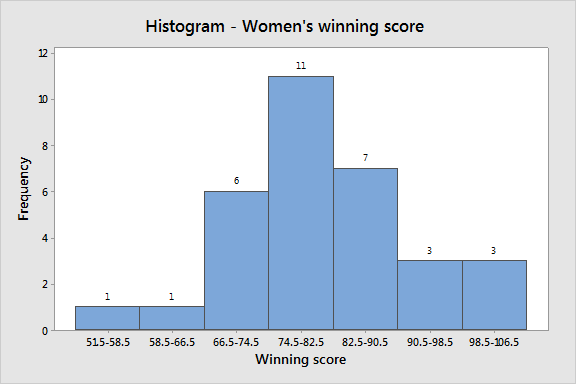
Using seven classes, the class width is calculated in the following way:
The frequency table is as follows:
| Class-limits | Class boundaries | Frequency |
| 51–58 | 51.5–58.5 | 1 |
| 59–66 | 58.5–66.5 | 1 |
| 67–74 | 66.5–74.5 | 6 |
| 75–82 | 74.5–82.5 | 11 |
| 83–90 | 82.5–90.5 | 7 |
| 91–98 | 90.5–98.5 | 3 |
| 99–106 | 98.5–106.5 | 3 |
To construct the histogram by using the MINITAB, the steps are as follows:
Step 1: Enter the class boundaries in C9 and frequency in C10.
Step 2: Go to Graph > Histogram > Simple.
Step 3: Enter C9 in Graph variable, then go to Data options > Frequency > C10.
Step 4: Click on OK.
The obtained histogram is:
Using 10 classes, the class width calculated in the following way:
The frequency table is as follows:
| Class-limits | Class boundaries | Frequency |
| 51–55 | 50.5–55.5 | 1 |
| 56–60 | 55.5–60.5 | 0 |
| 61–65 | 60.5–65.5 | 0 |
| 66–70 | 65.5–70.5 | 5 |
| 71–75 | 70.5–75.5 | 3 |
| 76–80 | 75.5–80.5 | 9 |
| 81–85 | 80.5–85.5 | 6 |
| 86–90 | 85.5–90.5 | 2 |
| 91–95 | 90.5–95.5 | 0 |
| 96 and more | 95.5 and more | 6 |
To construct the histogram by using the MINITAB, the steps are as follows:
Step 1: Enter the class boundaries in C11 and frequency in C12.
Step 2: Go to Graph > Histogram > Simple.
Step 3: Enter C11 in Graph variable, then go to Data options > Frequency > C12.
Step 4: Click on OK.
The obtained histogram is
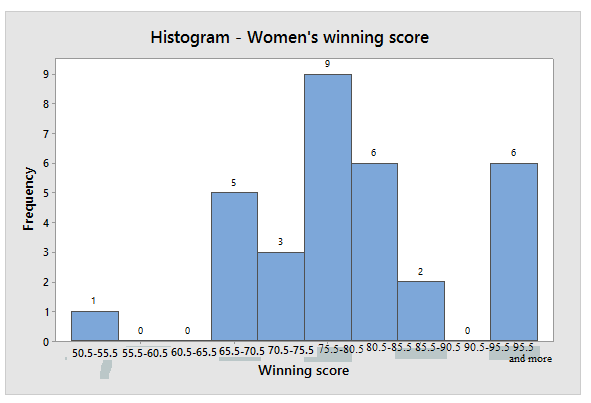
Using number classes five and seven in both data sets of men’s and women’s seem to be the best because histograms for that classes shows reliable distribution but using classes ten show gap between the bars. Since, using five classes seems best than using classes seven.
Want to see more full solutions like this?
Chapter 2 Solutions
WebAssign Printed Access Card for Brase/Brase's Understanding Basic Statistics, Enhanced, 7th Edition, Single-Term


 Holt Mcdougal Larson Pre-algebra: Student Edition...AlgebraISBN:9780547587776Author:HOLT MCDOUGALPublisher:HOLT MCDOUGAL