
Statistics for Business and Economics (13th Edition)
13th Edition
ISBN: 9780134648385
Author: MCCLAVE
Publisher: PEARSON
expand_more
expand_more
format_list_bulleted
Videos
Textbook Question
Chapter 2, Problem 2.152ACB
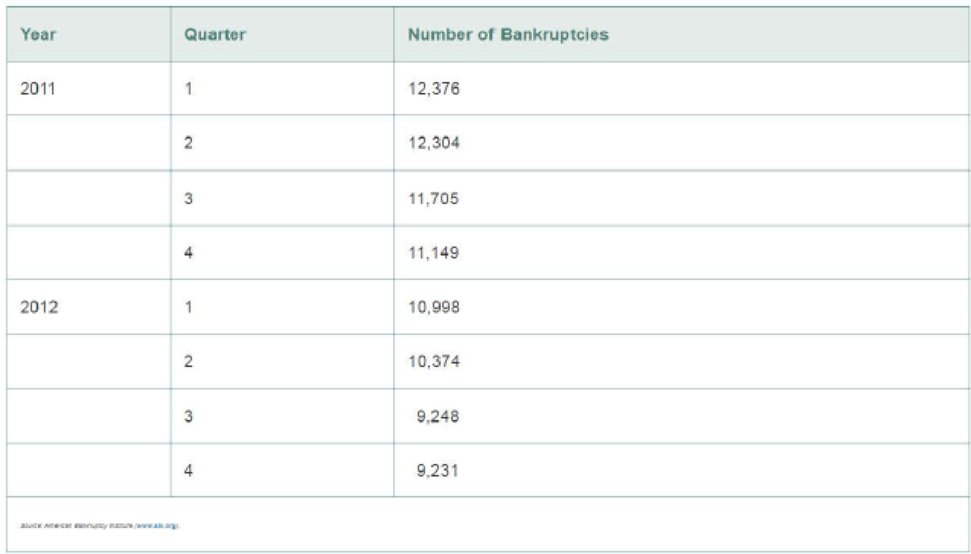
U.S. business bankruptcies. The American Bankruptcy Institute and the National Bankruptcy Research Center monitor the number of business bankruptcy filings each quarter. The table below lists the number of business bankruptcy filings for each quarter of a recent 2-year period.
- a. Explain why the data in the table represent time series data.
- b. Construct a time series plot for the quarterly number of bankruptcy filings.
- c. Do you detect a trend in the time series plot? Explain.
Expert Solution & Answer
Want to see the full answer?
Check out a sample textbook solution
Students have asked these similar questions
U.S. Civilian Labor Force (thousands)
Year
Labor Force
Year
Labor Force
2007
153,918
2012
155,628
2008
154,655
2013
155,151
2009
153,111
2014
156,238
2010
153,650
2015
157,957
2011
153,995
2016
159,640
1. Fit three trend models: linear, exponential, and quadratic. Which model would offer the most believable forecasts?
2. Make forecasts using the following fitted trend models for years 2017-2019.
t Exponential
11
12
13
Year Gross Federal Debt ($millions)
1945 260,123
1950 256,853
1955 274,366
1960 290,525
1965 322,318
1970 380,921
1975 541,925
1980 909,050
1985 1,817,521
1990 3,206,564
1995 4,921,005
2000 5,686,338
Construct a scatter plot with this data. Do you observe a trend? If so, what type of trend do you observe?
Use Excel to fit a linear trend and an exponential trend to the data. Display the models and their respective r^2.
Interpret both models. Which model seems to be more appropriate? Why?
In retail, a store manager uses time series models to understand shopping trends.
Review the scatter plot of the store’s sales from 2010 through 2021 to answer the questions. See attached as image.
Here is the data for Fiscal Year and Sales:
Fiscal Year
Sales
2010
$260,123.00
2011
$256,853.00
2012
$274,366.00
2013
$290,525.00
2014
$322,318.00
2015
$380,921.00
2016
$541,925.00
2017
$909,050.00
2018
$1,817,521.00
2019
$3,206,564.00
2020
$4,921,005.00
2021
$5,686,338.00
Time series decomposition seeks to separate the time series (Y) into 4 components: trend (T), cycle (C), seasonal (S), and irregular (I). What is the difference between these components?
The model can be additive or multiplicative. When do you use each?
Review the scatter plot of the exponential trend of the time series data. Do you observe a trend? If so, what type of trend do you observe?
What predictions might you make about the store’s annual sales over the next few years?
Chapter 2 Solutions
Statistics for Business and Economics (13th Edition)
Ch. 2.1 - Complete the following table.Ch. 2.1 - A qualitative variable with three classes (X, Y,...Ch. 2.1 - STEM experiences for girls. The National Science...Ch. 2.1 - Cable TV subscriptions and cord cutters. Has the...Ch. 2.1 - Do social robots walk or roll? A social (or...Ch. 2.1 - Top credit card issuers, by region. The Nilson...Ch. 2.1 - Microsoft program security issues. To help its...Ch. 2.1 - Jamming attacks on wireless networks. Refer to the...Ch. 2.1 - The Apprentice contestants performance ratings....Ch. 2.1 - The economic return to earning an MBA. Refer to...
Ch. 2.1 - Profiling UK rental malls. An analysis of the...Ch. 2.1 - History of corporate acquisitions. A corporate...Ch. 2.1 - Twitter opinions of iPhone 6 features. What are...Ch. 2.1 - Museum management. What criteria do museums use to...Ch. 2.1 - Advertising with reader-response cards....Ch. 2.1 - Motivation and right-oriented bias. Evolutionary...Ch. 2.1 - Groundwater contamination in wells. In New...Ch. 2.2 - Graph the relative frequency histogram for the 500...Ch. 2.2 - Refer to Exercise 2.18. Calculate the number of...Ch. 2.2 - Consider the stem-and-leaf display shown here. a....Ch. 2.2 - Minitab was used to generate the following...Ch. 2.2 - Stability of compounds in new drugs. Testing the...Ch. 2.2 - Corporate sustainability of CPA firms. Refer to...Ch. 2.2 - Sanitation inspection of cruise ships. To minimize...Ch. 2.2 - History of corporate acquisitions. Refer to the...Ch. 2.2 - Most valuable NFL teams. Each year Forbes reports...Ch. 2.2 - State SAT scores. Educators are constantly...Ch. 2.2 - Items arriving and departing a work center. In a...Ch. 2.2 - Crude oil biodegradation. In order to protect...Ch. 2.2 - Volkswagen emissions scandal. Recently, the...Ch. 2.2 - Is honey a cough remedy? Does a teaspoon of honey...Ch. 2.2 - Time in bankruptcy. Financially distressed firms...Ch. 2.2 - Prob. 2.33ACACh. 2.2 - Prob. 2.34ACACh. 2.3 - Calculate the mean and median of the following...Ch. 2.3 - Calculate the mean for samples where a. n = 10, x...Ch. 2.3 - Explain how the relationship between the mean and...Ch. 2.3 - Explain the difference between the calculation of...Ch. 2.3 - Calculate the mode, mean, and median of the...Ch. 2.3 - Calculate the mean, median, and mode for each of...Ch. 2.3 - Describe how the mean compares to the median for a...Ch. 2.3 - Use the applet entitled Mean versus Median to find...Ch. 2.3 - Prob. 2.2AECh. 2.3 - Use the applet Mean versus Median to study the...Ch. 2.3 - Hotels use of ecolabels. Ecolabels such as Energy...Ch. 2.3 - Rankings of research universities. Based on...Ch. 2.3 - Performance of stock screeners. Investment...Ch. 2.3 - Performance-based logistics. Refer to the Journal...Ch. 2.3 - Surface roughness of oil field pipe. Oil field...Ch. 2.3 - Prob. 2.47ACICh. 2.3 - Corporate sustainability of CPA firms. Refer to...Ch. 2.3 - Is honey a cough remedy? Refer to the Archives of...Ch. 2.3 - Crude oil biodegradation. Refer to the Journal of...Ch. 2.3 - Symmetric or skewed? Would you expect the data...Ch. 2.3 - Prob. 2.52ACICh. 2.3 - Prob. 2.53ACACh. 2.3 - Prob. 2.54ACACh. 2.3 - Prob. 2.55ACACh. 2.4 - Answer the following questions about variability...Ch. 2.4 - Calculate the range, variance, and standard...Ch. 2.4 - Calculate the variance and standard deviation for...Ch. 2.4 - Compute x,s2, and s for each of the following data...Ch. 2.4 - Calculate the range, variance, and standard...Ch. 2.4 - Using only integers between 0 and 10, construct...Ch. 2.4 - Using only integers between 0 and 10, construct...Ch. 2.4 - Consider the following sample of five...Ch. 2.4 - Use the applet entitled Standard Deviation to find...Ch. 2.4 - Use the applet Standard Deviation to study the...Ch. 2.4 - Use the applet Standard Deviation to study the...Ch. 2.4 - Hotels use of ecolabels. Refer to the Journal of...Ch. 2.4 - Permeability of sandstone during weathering. Refer...Ch. 2.4 - Performance of stock screeners. Refer to the...Ch. 2.4 - Corporate sustainability of CPA firms. Refer to...Ch. 2.4 - Is honey a cough remedy? Refer to the Archives of...Ch. 2.4 - Active nuclear power plants. Refer to Exercise...Ch. 2.4 - Estimating production time. A widely used...Ch. 2.5 - The output from a statistical software package...Ch. 2.5 - Prob. 2.72LMCh. 2.5 - For a set of data with a mound-shaped relative...Ch. 2.5 - The following is a sample of 25 measurements: a....Ch. 2.5 - Given a data set with a largest value of 760 and a...Ch. 2.5 - Voltage sags and swells. The power quality of a...Ch. 2.5 - Permeability of sandstone during weathering. Refer...Ch. 2.5 - Do social robots walk or roll? Refer to the...Ch. 2.5 - College dropout study. The American Economic...Ch. 2.5 - Motivation of drug dealers. Consider a study of...Ch. 2.5 - Sanitation inspection of cruise ships. Refer to...Ch. 2.5 - Volkswagen emissions scandal. Refer to the...Ch. 2.5 - Auditing water resources in Australia. Australia...Ch. 2.5 - The Apprentice contestants performance ratings....Ch. 2.5 - Shopping vehicle and judgment. While shopping at...Ch. 2.5 - Buy-side vs. sell-side analysts earnings...Ch. 2.5 - Prob. 2.87ACACh. 2.5 - Improving SAT scores. The National Education...Ch. 2.5 - Prob. 2.89ACACh. 2.6 - Compute the z-score corresponding to each of the...Ch. 2.6 - Give the percentage of measurements in a data set...Ch. 2.6 - In terms of percentiles, define QL, QM and QU.Ch. 2.6 - Compare the z-scores to decide which of the...Ch. 2.6 - Suppose that 40 and 90 are two elements of a...Ch. 2.6 - Mathematics assessment test scores. According to...Ch. 2.6 - Prob. 2.96ACBCh. 2.6 - Prob. 2.97ACBCh. 2.6 - Sanitation inspection of cruise ships Refer to the...Ch. 2.6 - Prob. 2.99ACICh. 2.6 - Prob. 2.100ACICh. 2.6 - Executive networking and firm performance. Do...Ch. 2.6 - Blue- vs. red-colored exam study. In a study of...Ch. 2.6 - Ranking PhD programs in economics. Thousands of...Ch. 2.6 - Using z-scores for grades. At one university, the...Ch. 2.6 - Prob. 2.105ACACh. 2.7 - A sample data set has a mean of 57 and a standard...Ch. 2.7 - Suppose a data set consisting of exam scores has a...Ch. 2.7 - Consider the horizontal box plot shown below. a....Ch. 2.7 - Prob. 2.109LMCh. 2.7 - Prob. 2.7AECh. 2.7 - Rankings of research universities. Refer to the...Ch. 2.7 - Voltage sags and swells. Refer to the Electrical...Ch. 2.7 - Treating psoriasis with the Doctorfish of Kangal....Ch. 2.7 - Budget lapsing at army hospitals. Accountants use...Ch. 2.7 - Salary offers to MBAs. Consider the top salary...Ch. 2.7 - Prob. 2.115ACICh. 2.7 - Prob. 2.116ACICh. 2.7 - Sanitation inspection of cruise ships. Referto...Ch. 2.7 - Network server downtime. A manufacturer of network...Ch. 2.7 - Permeability of sandstone during weathering. Refer...Ch. 2.7 - Prob. 2.120ACACh. 2.7 - Prob. 2.121ACACh. 2.8 - Construct a scatterplot for the data in the...Ch. 2.8 - Construct a scatterplot for the data in the...Ch. 2.8 - Prob. 2.124ACBCh. 2.8 - Prob. 2.125ACBCh. 2.8 - Lobster trap placement. Strategic placement of...Ch. 2.8 - Does elevation impact hitting performance in...Ch. 2.8 - Prob. 2.128ACBCh. 2.8 - Prob. 2.129ACBCh. 2.8 - Spreading rate of spilled liquid A contract...Ch. 2.8 - Performance ratings of government agencies. The...Ch. 2.8 - Most valuable NFL teams. Refer to the Forbes...Ch. 2.8 - Best-paid CEOs. Refer to Glassdoor Economic...Ch. 2.8 - Prob. 2.134ACACh. 2.10 - Museum management. Refer to the Museum Management...Ch. 2.10 - Volkswagen emissions scandal. Refer to the...Ch. 2.10 - BP oil leak. In the summer of 2010, an explosion...Ch. 2 - Construet a relative frequency histogram for the...Ch. 2 - Discuss the conditions under which the median is...Ch. 2 - Consider the following three measurements: 50, 70,...Ch. 2 - Refer to Exercise 2.141c. For parts a-d, determine...Ch. 2 - For each of the following data sets, compute x,...Ch. 2 - For each of the following data sets, compute x,...Ch. 2 - Explain why we generally prefer the standard...Ch. 2 - If the range of a set of data is 20, find a rough...Ch. 2 - Prob. 2.147LMCh. 2 - Motivation of drug dealers. Refer to the Applied...Ch. 2 - Slogs for Fortune 500 firms. Web site...Ch. 2 - Management system failures. The U.S. Chemical...Ch. 2 - Business marketing publications....Ch. 2 - U.S. business bankruptcies. The American...Ch. 2 - Prob. 2.153ACBCh. 2 - Products Made in the USA. Made in the USA is a...Ch. 2 - Prob. 2.155ACBCh. 2 - Drivers stopped by police. According to the Bureau...Ch. 2 - U.S. wine export markets. The Center for...Ch. 2 - Prob. 2.158ACICh. 2 - Hull failures of oil tankers. Owing to several...Ch. 2 - Software defects. The Promise Software Engineering...Ch. 2 - Prob. 2.161ACICh. 2 - Time to develop price quotes. A manufacturer of...Ch. 2 - Trend in Iraq War casualties. While the United...Ch. 2 - Prob. 2.164ACICh. 2 - Radiation levels in homes. In some locations,...Ch. 2 - Doctors and ethics. For physicians confronted with...Ch. 2 - Prob. 2.167ACICh. 2 - Investigating the claims of weight-loss clinics....Ch. 2 - Age discrimination study. The Age Discrimination...Ch. 2 - No Child Left Behind Act. According to the...Ch. 2 - Steel rod quality. In his essay Making Things...
Knowledge Booster


Learn more about
Need a deep-dive on the concept behind this application? Look no further. Learn more about this topic, statistics and related others by exploring similar questions and additional content below.Similar questions
- Use this data for the exercises that follow: In 2013, there were roughly 317 million citizens in the United States, and about 40 million were elderly (aged 65 and over).[34] 60. It is predicted that by 2030, one in five U.S. citizens will be elderly. How much greater will the chances of meeting an elderly person be at that time? What policy changes do you foresee if these statistics hold true?arrow_forwardUnited Dairies, Inc., supplies milk to several independent grocers throughout DadeC ounty, Florida. Managers at United Dairies want to develop a forecast of the number ofhalf gallons of milk sold per week. Sales data for the past 12 weeks are: a. Construct a time series plot. What type of pattern exists in the data?b. Use exponential smoothing with a 5 0.4 to develop a forecast of demand for week 13.What is the resulting MSE?arrow_forwardThe Seneca Children’s Fund (SCC) is a local charity that runs a summer camp for disadvantagedchildren. The fund’s board of directors has been working very hard over recentyears to decrease the amount of overhead expenses, a major factor in how charities arerated by independent agencies. The following data show the percentage of the money SCChas raised that was spent on administrative and fund-raising expenses over the last sevenyears. a. Construct a time series plot. What type of pattern exists in the data?b. Use simple linear regression analysis to find the parameters for the line that minimizesMSE for this time series.c. Forecast the percentage of administrative expenses for year 8.d. If SCC can maintain its current trend in reducing administrative expenses, how longwill it take SCC to achieve a level of 5 percent or less?arrow_forward
- Interpret the time plot. What are the components you can observe in the time series plot? Is the data stationary? Explainarrow_forwardConsider the following time series. Quarter Year 1 Year 2 Year 3 1 70 67 61 2 50 42 52 3 59 61 54 4 79 82 73 (a) Construct a time series plot. What type of pattern exists in the data? Is there an indication of a seasonal pattern? The time series plot shows a horizontal pattern, but there is also a seasonal pattern in the data.The time series plot shows a horizontal pattern with no seasonal pattern present. The time series plot shows a trend pattern, but there is also a seasonal pattern in the data.The time series plot shows a trend pattern with no seasonal pattern present. (b) Use a multiple linear regression model with dummy variables as follows to develop an equation to account for seasonal effects in the data. x1 = 1 if quarter 1, 0 otherwise; x2 = 1 if quarter 2, 0 otherwise; x3 = 1 if quarter 3, 0 otherwise. ŷ = (c) Compute the quarterly forecasts for the next year. quarter 1 forecast quarter 2 forecast quarter 3 forecast quarter 4 forecastarrow_forwardAn electronic appliance manufacturer wants to know if there is a relationship between percentage change in deposable personal income which is reported quarterly by the government, and the percentage change in appliances sold by the manufacturer following same years of quarterly data. Brenda Chee and Clarence Paulus lead an analyst team has obtained data for the past 10 quarters. (Hint: Provides your answers in two decimal points) Quarter Percent change in income Percent Change in appliance sold Quarter Percent change in income Percent change in appliance sold 1 -2.3 -2.5 6 -1.0 1.0 2 -1.5 -1.0 7 0.7 1.4 3 2.8 7.4 8 5.2 3.4 4 0.5 2.6 9 -2.5 -0.5 5 4.6 8.5 10 1.7 1.8 (a) What forecasting model should be used for this data. Why?(5(b) Develop the forecasting model that you have proposed in (a).(c) Compute the relationship for these data. In your opinion, is the relationship between independentvariable…arrow_forward
- Year Missouri Maine 1950 38800 29400 2000 89900 98700 If these trends were to continue, what would be the median home value in Missouri in 2010? c) If we assume the linear trend existed before 1950 and continues after 2000, the two states' median house values will be (or were) equal in what year?arrow_forwardU.S. Civilian Labor Force (thousands)Year Labor Force Year Labor Force2007 173,966 2012 175,6762008 174,703 2013 175,1992009 173,159 2014 176,2862010 173,698 2015 178,0052011 174,043 2016 179,688 Make forecasts using the following fitted trend models for years 2017-2019. t Linear Quadratic Exponential 111213arrow_forwardWhat is the ratio of the total jobs at risk in Transportation and Storage to those at riks in Retail? A) 4.68:7.79 B) 7.79:4.68 C) 52:41 D) 9:19 E) 30:27 Transcribed Image Text:Likelihood of industries becoming automated in the future Proportion of jobs and their risk of automation. Note: the graph shows a linear decrease in the proportion of jobs at risk of full automation. 60% 55% 50% 45% 40% 35% 30% 25% 20% 15% 10% 5% 0% Transportation and Storage Series Value Proportion of Jobs at Risk of Full Automation 52% Employment Share of Total Jobs Waste Management Transportation and 9% Manufacturing Retail Administration Finance and Insurance ch Other Electricity and Gas Transcribed Image Text:Likelihood of industries becoming automated in the future Proportion of jobs and their risk of automation. Note: the graph shows a linear decrease in the proportion of jobs at risk of full automation. 60% 55% 50% 45% 40% 35% 30% 25% 20% 15% 10% 5% 0% Waste Management Transportation and Retail…arrow_forward
- For the hawkins company, the monthly percentages of all shipments received on timeover the past 12 months are 80, 82, 84, 83, 83, 84, 85, 84, 82, 83, 84, and 83.a. construct a time series plot. What type of pattern exists in the data?arrow_forwardThe analysis of Earnings Per Share (EPS) is as follows: 2015: $5.70 2016: $3.30 2017: $6.21 2018: $6.20 2019: $4.91 a. What is the trend analysis for that EPS and why it is increasing and decreasing?arrow_forwardCoca-Cola Revenues ($ millions), 2014 to 2019 Quarter 2014 2015 2016 2017 2018 2019 Quarter 1 10.58 9.94 10.28 9.12 7.63 8.02 Quarter 2 12.57 11.63 11.54 9.70 9.42 10.00 Quarter 3 11.98 11.77 10.63 9.08 8.78 9.51 Quarter4 10.87 10.13 9.41 7.51 5.36 9.07 What is the trend model for the deseasonalized time series? (Round your answers to 2 decimal places.) State the model found when performing a regression using seasonal binaries. (A negative value should be indicated by a minus sign. Round your answers to 4 decimal places.) Use the regression equation to make a prediction for each quarter in 2020. (Enter your answers in millions rounded to 3 decimal places.)arrow_forward
arrow_back_ios
SEE MORE QUESTIONS
arrow_forward_ios
Recommended textbooks for you
 Glencoe Algebra 1, Student Edition, 9780079039897...AlgebraISBN:9780079039897Author:CarterPublisher:McGraw Hill
Glencoe Algebra 1, Student Edition, 9780079039897...
Algebra
ISBN:9780079039897
Author:Carter
Publisher:McGraw Hill
Time Series Analysis Theory & Uni-variate Forecasting Techniques; Author: Analytics University;https://www.youtube.com/watch?v=_X5q9FYLGxM;License: Standard YouTube License, CC-BY
Operations management 101: Time-series, forecasting introduction; Author: Brandoz Foltz;https://www.youtube.com/watch?v=EaqZP36ool8;License: Standard YouTube License, CC-BY