
Videos
Three groups of students from the
(a)
(b)
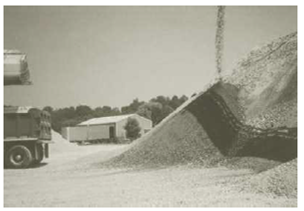
Figure 2.35 (a) Soil-aggregate stockpile; (b) sieve analysis (Courtesy of Khaled Sobhan, Florida Atlantic University, Boca Raton, Florida)
a. Determine the coefficient of uniformity and the coefficient of gradation for Soils A, B, and C.
b. Which one is coarser: Soil A or Soil C? Justify your answer.
c. Although the soils are obtained from the same stockpile, why are the curves so different? (Hint: Comment on particle segregation and representative field sampling.)
d. Determine the percentages of gravel, sand and fines according to Unified Soil Classification System.
(a)
Calculate the coefficient of uniformity
Answer to Problem 2.1CTP
The uniformity coefficient of soil A is
The coefficient of gradation of soil A is
The uniformity coefficient of soil B is
The coefficient of gradation of soil B is
The uniformity coefficient of soil C is
The coefficient of gradation of soil C is
Explanation of Solution
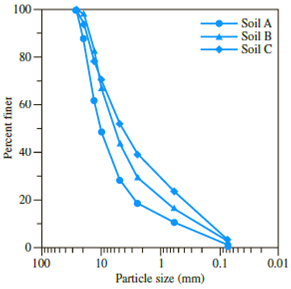
Sketch the grain size distribution curve for soils A, B, and C as shown in Figure 1.
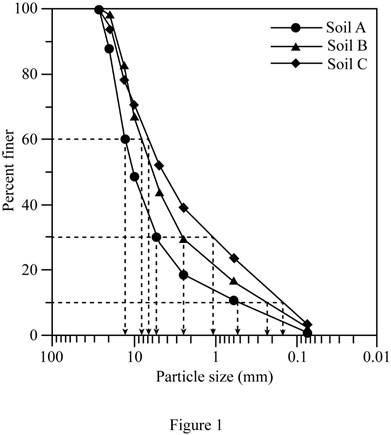
Refer to Figure 1.
For soil A:
The diameter of the particle corresponding to
The diameter of the particle corresponding to
The diameter of the particle corresponding to
For soil B:
The diameter of the particle corresponding to
The diameter of the particle corresponding to
The diameter of the particle corresponding to
For soil C:
The diameter of the particle corresponding to
The diameter of the particle corresponding to
The diameter of the particle corresponding to
Calculate the uniformity coefficient
For soil A:
Substitute
Hence, the uniformity coefficient for soil A is
For soil B:
Substitute
Hence, the uniformity coefficient for soil B is
For soil C:
Substitute
Hence, the uniformity coefficient for soil C is
Calculate the coefficient of gradation
For soil A:
Substitute
Hence, the coefficient of gradation for soil A is
For soil B:
Substitute
Hence, the coefficient of gradation for soil B is
For soil C:
Substitute
Therefore, the coefficient of gradation for soil C is
(b)
State which of the soil is coarser from soil A and C.
Answer to Problem 2.1CTP
Soil A is coarser than soil C.
Explanation of Solution
Refer to part (a).
The uniformity coefficient of soil A is
The uniformity coefficient of soil C is
The percent of soil finer than
The percent of soil finer than
Hence, a higher percentage of soil C is finer than soil A.
Hence, soil A is coarser than soil C.
(c)
Explain the reason for curve different of soil A, B and C if it is obtained from same stockpile.
Explanation of Solution
The particle-size distribution curve shows the range of particle sizes present in a soil and the type of distribution of various-size particles.
Refer to Figure 1.
Particle separation of coarser and finer particles may take place in aggregate stockpiles. This makes representative sampling difficult.
Therefore, the particle-size distribution curve is different for soils A, B, and C.
(d)
Calculate the percentages of gravel, sand, and fines according to the Unified Soil Classification System.
Answer to Problem 2.1CTP
The percentage of gravel for soil A is
The percentage of sand for soil A is
The percentage of fines for soil A is
The percentage of gravel for soil B is
The percentage of sand for soil B is
The percentage of fines for soil B is
The percentage of gravel for soil C is
The percentage of sand for soil C is
The percentage of fines for soil C is
Explanation of Solution
Refer to Figure 1.
For soil A.
The percent passing through
The percent passing through
Calculate the percentage of gravel as shown below.
Hence, the percentage of gravel is
Calculate the percentage of sand as shown below.
Hence, the percentage of sand is
Calculate the percentage of fines as shown below.
Hence, the percentage of fines is
Refer to Figure 1.
For soil B.
The percent passing through
The percent passing through
Calculate the percentage of gravel as shown below.
Hence, the percentage of gravel is
Calculate the percentage of sand as shown below.
Hence, the percentage of sand is
Calculate the percentage of fines as shown below.
Hence, the percentage of fines is
Refer to Figure 1.
For soil C.
The percent passing through
The percent passing through
Calculate the percentage of gravel as shown below.
Hence, the percentage of gravel is
Calculate the percentage of sand as shown below.
Hence, the percentage of sand is
Calculate the percentage of fines as shown below.
Hence, the percentage of fines is
Want to see more full solutions like this?
Chapter 2 Solutions
Principles of Geotechnical Engineering (MindTap Course List)


- Refer to Problem 2.C.1. Results of the sieve analysis for Soils A, B, and C are given below. To obtain a more representative sample for further geotechnical testing, a ternary blend is created by uniformly mixing 8000 kg of each soil. Answer the following questions. a. If a sieve analysis is conducted on the mixture using the same set of sieves as shown above, compute the mass retained (as a percentage) and cumulative percent passing in each sieve. b. What would be the uniformity coefficient (Cu) and the coefficient of gradation (Cc) of the mixture?arrow_forwardA hydrometer test has the following result: Gs = 2.65, temperature of water = 26 C, and L = 10.4 cm at 45 minutes after the start of sedimentation (see Figure 2.25). What is the diameter D of the smallest-size particles that have settled beyond the zone of measurement at that time (that is, t = 45 min)? Figure 2.25 ASTM 152H type of hydrometer placed inside the sedimentation cylinder (Courtesy of Khaled Sobhan, Florida Atlantic University, Boca Raton, Florida)arrow_forwardRefer to the soil in Problem 4.5. Using the Casagrande plasticity chart, graphically estimate the shrinkage limit of the soil as shown in Figure 4.22. 4.5 The following data were obtained by conducting liquid limit and plastic limit tests on a soil collected from the site. Liquid limit tests: Plastic limit test: PL = 19.3% a. Draw the flow curve and determine the liquid limit. b. Using the Casagrande plasticity chart (Figure 4.21), determine the soil type.arrow_forward
- The subsurface characteristics for a highway pavement rehabilitation project in the southeastern United States are shown in a boring log in Figure 5.13. The highway structure consists of the asphalt pavement underlain by four different soil strata up to a depth of 20 ft, after which the boring was terminated. Some data on the grain size and plasticity characteristics are also provided for each stratum. Perform the following tasks: 1. Determine the AASHTO soil classification and the group index (GI) for each layer. 2. Determine the most probable group symbols and group names for the various layers according to the Unified soil classification system. Use Table 5.3 and the soil characteristics given in the boring log.arrow_forwardAnalyze each statement (A and B) whether they are true or false. Use the choices below in answering each item; A statement A is true B statement B is true C both A and B are true D neither A nor B are true (A) Particle density is commonly analyzed using soil core method (B) In core analysis, given the same sample, a smaller core will yield higher density values, while a larger core will yield larger density values.arrow_forwardA deposit soil sample contains 50 grams of sand, 8.4 grams of gravel, 6.6 grams of air as void and 5.0 grams of water content, compute the following: i) overall sample weight; ii) percentage (%) sand content; iii) percentage (%) gravel composition in the sample; iv) percentage (%) void air in the sample; v) percentage (%) of water contentarrow_forward
- The following are the results of a sieve analysis: Sieve size Weight Retained 9.5mm 0 4.75mm 86g 2.36mm 379g 1.18mm 595g Pan 440g Determine the percent finer than each sieve and plot a grain-size distribution curve. Determine D10, D30 and D60 from the grain-size distribution curve.arrow_forwardThe following results were obtained by testing a sample of clay: water content 25.6%, liquid limit 43.5%, plastic limit 19.1%. From this compute the following: (a) Liquidity Index (b) Plasticity Index (c) Shrinkage Limitarrow_forwardThe laboratory consolidation test is conducted on a clay sample. The following data results were obtained P1 =55 kPa P2 = 130 kPa e1= 0.95 e2= 0.80 Thickness of the sample of clay= 35mm Time for 50% consolidation = 3.0 min Tv= 0.197 a. Find the coefficient of volume compressibility b. Determine the coefficient of consolidation if a sample of clay was drained on both sides c. Compute the hydraulic conductivity of the clayarrow_forward
- Mechanical analysis on four different samples designated as A, B, Cand D were carried out in a soil laboratory. The results of tests are given below. Hydrometer analysis was carried out on sample D. The soil is non-plastic. Sample D. liquid limit w 42, plastic limit = 24, plasticity index = 18 Classify the soils per the Unified Soil Classification System. Samples ASTM Sieve Percentage finer than Designation 63.0 mm 100 93 20.0 mm 64 76 6.3 39 100 65 20 mm 600 212 63A 20 24 98 59 12 90 54 5 9. 47 100 34 95 23 69 7. 46 2 31 100 HO 60 20 Sand Course lo medium Cotles l>762 mm Clay Silt Gravel Fine 0.001 001 0.075 0.1 10 100 Particle size (mum) Figure Ex. 3.21 Percentage finerarrow_forwardIn a hydrometer test, the results are as follows: Gs=2.55 Temperature of water=25 degree Celsius, and R=41 at 2 hours after the start of sedimentation. What is the diameter, d, of the smallest-size particles that have settled beyond the zone of measurement at that time? Please answer this asaparrow_forwardEngineering statistics, i need solutions in 15 minutes please. MCQ/The table below shows the results from the specific gravity (S.G.) test performed in a soil laboratory including twenty samples of sand. Determine the Coefficient of Quartile Variation. A-0.011 B-0.033 C-0.024 D-0.087 E-0.065arrow_forward
 Principles of Geotechnical Engineering (MindTap C...Civil EngineeringISBN:9781305970939Author:Braja M. Das, Khaled SobhanPublisher:Cengage Learning
 Traffic and Highway EngineeringCivil EngineeringISBN:9781305156241Author:Garber, Nicholas J.Publisher:Cengage Learning