
LIND 18E STATISTICAL TECHNIQUES IN BUSIN
18th Edition
ISBN: 9781264307746
Author: Lind
Publisher: McGraw Hil
expand_more
expand_more
format_list_bulleted
Concept explainers
Videos
Textbook Question
Chapter 2, Problem 25CE
Alexandra Damonte will be building a new resort in Myrtle Beach, South Carolina. She must decide how to design the resort based on the type of activities that the resort will offer to its customers. A recent poll of 300 potential customers showed the following results about customers’ preferences for planned resort activities:
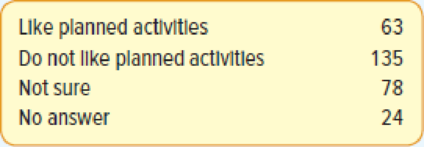
- a. What is the table called?
- b. Draw a bar chart to portray the survey results.
- c. Draw a pie chart for the survey results.
- d. If you are preparing to present the results to Ms. Damonte as part of a report, which graph would you prefer to show? Why?
Expert Solution & Answer
Want to see the full answer?
Check out a sample textbook solution
Students have asked these similar questions
One hundred twelve people who grew up in either City A or City B were surveyed to determine whether they preferred country music or blues (both and neither were not acceptable responses). Of those who grew up in City B, 48 preferred blues and 15 preferred country music. Of those who grew up in City A 27 preferred country. Answer parts (a) through (d) below.
a. Complete the two-way table summarizing the reviews.
Country Music
Blues
City A
27
City B
48
(Type whole numbers.)
A study of 552 first-year college students asked about their preferences for online resources. One question asked them to pick their
favorite. Here are the results in a pie chart.
Pie Chart for the Online Resource
Wikipedia
9%
Libriary
14%
Other
Google
74%
Select correct answer(s). This is a multiple-answer question. It may have more than one correct answers.
i. The percentage in the pie chart shows the percent for each category of a qualitative or a categorical variable.
ii. Google is the favorite for about three-quarters of the students.
iii. More than 85% of the students are in favor of using either Google or library.
iv. Less than 20% of the students are in favor of using either library or Wikipedia.
Two hundred consumers were surveyed about a new brand of snack food, Crunchicles. Their age groups and
preferences are given in the table.
Chapter 2 Solutions
LIND 18E STATISTICAL TECHNIQUES IN BUSIN
Ch. 2 - DeCenzo Specialty Food and Beverage Company has...Ch. 2 - A pie chart shows the relative market share of...Ch. 2 - In a marketing study, 100 consumers were asked to...Ch. 2 - A total of 1,000 residents in Minnesota were asked...Ch. 2 - Two thousand frequent business travelers are asked...Ch. 2 - Wellstone Inc. produces and markets replacement...Ch. 2 - A small business consultant is investigating the...Ch. 2 - In the first quarter of last year, the 11 members...Ch. 2 - Prob. 3SRCh. 2 - A set of data consists of 38 observations. How...
Ch. 2 - A set of data consists of 45 observations between...Ch. 2 - A set of data consists of 230 observations between...Ch. 2 - A set of data contains 53 observations. The...Ch. 2 - Wachesaw Manufacturing Inc. produced the following...Ch. 2 - The Quick Change Oil Company has a number of...Ch. 2 - The manager of the BiLo Supermarket in Mt....Ch. 2 - The food services division of Cedar River...Ch. 2 - The annual imports of a selected group of...Ch. 2 - Mollys Candle Shop has several retail stores in...Ch. 2 - The following chart shows the number of patients...Ch. 2 - The following frequency distribution reports the...Ch. 2 - Prob. 18ECh. 2 - A sample of the hourly wages of 15 employees at...Ch. 2 - The following cumulative frequency and the...Ch. 2 - The cumulative frequency and the cumulative...Ch. 2 - The frequency distribution representing the number...Ch. 2 - Prob. 22ECh. 2 - Describe the similarities and differences of...Ch. 2 - Describe the similarities and differences between...Ch. 2 - Alexandra Damonte will be building a new resort in...Ch. 2 - Prob. 26CECh. 2 - A data set consists of 83 observations. How many...Ch. 2 - A data set consists of 145 observations that range...Ch. 2 - The following is the number of minutes to commute...Ch. 2 - The following data give the weekly amounts spent...Ch. 2 - A social scientist is studying the use of iPods by...Ch. 2 - David Wise handles his own investment portfolio,...Ch. 2 - Prob. 33CECh. 2 - The monthly issues of the Journal of Finance are...Ch. 2 - The following histogram shows the scores on the...Ch. 2 - The following chart summarizes the selling price...Ch. 2 - A chain of sport shops catering to beginning...Ch. 2 - Prob. 38CECh. 2 - A recent survey showed that the typical American...Ch. 2 - Midland National Bank selected a sample of 40...Ch. 2 - Residents of the state of South Carolina earned a...Ch. 2 - A recent study of home technologies reported the...Ch. 2 - Merrill Lynch recently completed a study regarding...Ch. 2 - Prob. 44CECh. 2 - Refer to the following chart: a. What is the name...Ch. 2 - The following chart depicts the annual revenues,...Ch. 2 - Prob. 47CECh. 2 - Prob. 48CECh. 2 - One of the most popular candies in the United...Ch. 2 - The number of families who used the Minneapolis...Ch. 2 - Refer to the North Valley Real Estate data that...Ch. 2 - Prob. 52DACh. 2 - Refer to the Lincolnville School District bus...
Knowledge Booster


Learn more about
Need a deep-dive on the concept behind this application? Look no further. Learn more about this topic, statistics and related others by exploring similar questions and additional content below.Similar questions
- Explain in your own words the difference between the mean, median, and mode of a set of numbers.arrow_forwardA market researcher asked a random sample of 100 individuals their favorite place to get coffee. The results are summarized in the table. Create a bar graph and a pie chart summarizing the data. Coffee Shop Number of individualsStarbucks 36Dunkin Donut 27Krispy Kreme 7Tim Horton’s 4Local 26arrow_forwardNote:- Do not provide handwritten solution. Maintain accuracy and quality in your answer. Take care of plagiarism. Answer completely. You will get up vote for sure.arrow_forward
- How do college professors spend their time? The National Education Association Almanac of Higher Education gives the following average distribution of professional time allocation: teaching, 44%; research, 15%; professional growth, 9%; community service, 11%; service to the college, 11%; and consulting outside the college, 10%. Make a pie chart showing the allocation of professional time for college professors. (choose one of the options)arrow_forwardQ. Find the median, mode and range: 3, 5, 7, 9, 11, 8, 3arrow_forwardIn a survey the maximum data point was 100 while the minimum data point was 10. if the number of classes was 5 which of the following would be an appropriate class size ? select one: a. 20 b.6 c. 10 d. 18arrow_forward
- Suppose automobile insurance companies gave annual premiums for top-rated companies in several states. The figure below shows box plots for the annual premium for urban customers in three states. Which state has the highest median premium?arrow_forwardSuppose Ted is creating a football team in a video game that features many NFL players. He decides to identify players who are outliers in a few statistics he has chosen. Currently, he's looking at wide receivers. The game includes the top 100 receivers in 2012 by number of receptions. Ted, however, is more interested in receiving yards, and the table shows the five-number summary of the available players in the game (in yards): Minimum 1st quartile (Q1) Median 3rd quartile (Q3) Maximum 258.0 549.5 743.0 936.5 1964.0 The mean is 787.6 yds with a standard deviation of 311.3 yds. Ted first calculates the interquartile range (IQR). Next, to determine suspected outliers, he calculates Q1 – 1.5 · IQR and Q3 + 1.5 · IQR. Specify those results to at least one decimal place. Q1 - 1.5 · IQR = Q3 + 1.5 · IQR =arrow_forwardHere are ratings (on a scale from 1 through 5) for various Super Bowl party foods. You have to decide which food is rated highest (5 is a winner and 1 a loser). Decide what type of average you will use and why.arrow_forward
- Geographer louie intends to investigate whether there is a difference in how happy tourists are with their journey depending on where they are in the country (which part of the country). He divided the country into 5 parts: capital, south, east, west og north and selected 30 tourists at random from each area and asked (e. Chose 30 tourists in each part) and asked, "how enjoyable has your journey been in these areas on a scale of 0-10". louie is happy to have taken statistics in his time because there he learned to analyze data of this kind with analysis of variance. He started filling out an ANOVA table but could not complete it. The table can be seen below. It can be assumed that satisfaction follows a normal distribution and the distribution is similar in the five areas (e. Assume that happiness follows a normal distribution and that the variance is similar in the 5 parts). SS df Ms Between within 43.7 total 56.2 XXX 1. What value should stand where xxx is in the table? а. 149 b. 4…arrow_forwardFind the median of the given sample: -11, -12, -10, 9, -8, -7, -6 -10 -8 -9arrow_forwardThirty-four college students were asked how much money they spent on textbooks for the current semester. Their responses are shown in the following stemplot. a. Describe a procedure for identifying potential outliers, and use the procedure to decide whether there are outliers among the responses for the money spent on textbooks. b.Based on the stemplot, write a few sentences describing the distribution of money spent on textbooks for the 34 students. c.One of the students spent $160 on books for the semester. If that value had been $260 instead, what effect would that increase have on the following statistics? Justify your answers. The mean The medianarrow_forward
arrow_back_ios
SEE MORE QUESTIONS
arrow_forward_ios
Recommended textbooks for you
 Glencoe Algebra 1, Student Edition, 9780079039897...AlgebraISBN:9780079039897Author:CarterPublisher:McGraw Hill
 Holt Mcdougal Larson Pre-algebra: Student Edition...AlgebraISBN:9780547587776Author:HOLT MCDOUGALPublisher:HOLT MCDOUGAL
 Big Ideas Math A Bridge To Success Algebra 1: Stu...AlgebraISBN:9781680331141Author:HOUGHTON MIFFLIN HARCOURTPublisher:Houghton Mifflin Harcourt
Glencoe Algebra 1, Student Edition, 9780079039897...
Algebra
ISBN:9780079039897
Author:Carter
Publisher:McGraw Hill
Holt Mcdougal Larson Pre-algebra: Student Edition...
Algebra
ISBN:9780547587776
Author:HOLT MCDOUGAL
Publisher:HOLT MCDOUGAL
Big Ideas Math A Bridge To Success Algebra 1: Stu...
Algebra
ISBN:9781680331141
Author:HOUGHTON MIFFLIN HARCOURT
Publisher:Houghton Mifflin Harcourt
Sampling Methods and Bias with Surveys: Crash Course Statistics #10; Author: CrashCourse;https://www.youtube.com/watch?v=Rf-fIpB4D50;License: Standard YouTube License, CC-BY
Statistics: Sampling Methods; Author: Mathispower4u;https://www.youtube.com/watch?v=s6ApdTvgvOs;License: Standard YouTube License, CC-BY