
FUNDAMENTAL OF CORPORATE FINANCE
4th Edition
ISBN: 9781323942925
Author: Berk
Publisher: PEARSON
expand_more
expand_more
format_list_bulleted
Videos
Textbook Question
Chapter 2, Problem 37P
Some balance sheet information is shown here (all values in millions of dollars) (see MyFinanceLab for the data in Excel format):
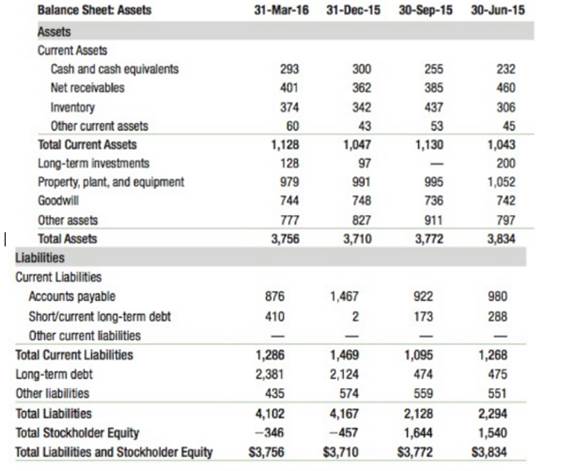
- What change in the book value of the company's equity took place at the end Of 2015?
- Is the company's market-to-book ratio meaningful? Is its book debt-equity ratiomeaningful? Explain.
- Find the company's other financial statements from that time online. What was the cause of the change to its book value of equity at the end of 2015?
- Does the company's book value of equity in 2016 imply that it is unprofitable? Explain.
Expert Solution & Answer
Want to see the full answer?
Check out a sample textbook solution
Students have asked these similar questions
Some balance sheet information is shown below: (all values in millions of dollars).
a. What change in the book value of the company's equity took place at the end of 2018?
b. Is the company's market-to-book ratio meaningful? Is its book debt-equity ratio meaningful? Explain.
a. What change in the book value of the company's equity took place at the end of 2018?
The book value of equity
▼
increased or decreased
by $_____ billion from the end of the previous year, and was
▼
positive or negative.
(Select from the drop-down menus and round to three decimal places.)
i. Use the following simplified 2019 balance sheet to show, in general terms, how an improvement in one of the ratios—say, the DSO—would affect the stock price. For example, if the company could improve its collection procedures and thereby lower the DSO from 38.1 days to 27.8 days, how would that change “ripple through” the financial statements (shown in thousands below) and influence the stock price?
Accounts receivable $ 402 Debt $ 965 Other current assets 888
Net fixed assets 361 Equity 686. Total assets $1,651 Total liabilities and equity $1,651
j. Although financial statement analysis can provide useful information about a company’s operations and its financial condition, this type of analysis does have some potential problems and limitations, and it must be used with care and judgment. What are some problems and limitations?
The Corrigan Corporation’s 2015 and 2016 financial statements follow,along with some industry average ratios.a. Assess Corrigan’s liquidity position, and determine how it compares with peers and how the liquidity position has changed over time.b. Assess Corrigan’s asset management position, and determine how it compares with peers and how its asset management efficiency has changed over time.c. Assess Corrigan’s debt management position, and determine how it compares with peers and how its debt management has changed over time.d. Assess Corrigan’s profitability ratios, and determine how they compare with peers and how its profitability position has changed over time.e. Assess Corrigan’s market value ratios, and determine how its valuation compares with peers and how it has changed over time.f. Calculate Corrigan’s ROE as well as the industry average ROE, using the DuPont equation. From this analysis, how does Corrigan’s financial position compare with the industry average numbers?g.…
Chapter 2 Solutions
FUNDAMENTAL OF CORPORATE FINANCE
Ch. 2 - Prob. 1CCCh. 2 - Prob. 2CCCh. 2 - What 's depreciation designed to capture?Ch. 2 - Prob. 4CCCh. 2 -
5. what do a firm’s earning measure?
Ch. 2 - 6. What is dilution?
Ch. 2 - Prob. 7CCCh. 2 - Prob. 8CCCh. 2 - Prob. 9CCCh. 2 - What information do the notes to financial...
Ch. 2 - Prob. 11CCCh. 2 - Prob. 12CCCh. 2 - Prob. 13CCCh. 2 - Prob. 14CCCh. 2 - Prob. 15CCCh. 2 - Prob. 16CCCh. 2 - Prob. 1CTCh. 2 - Prob. 2CTCh. 2 - Prob. 3CTCh. 2 - 4. What is the purpose of the income statement?
Ch. 2 - Prob. 5CTCh. 2 - Prob. 6CTCh. 2 - Prob. 7CTCh. 2 - Prob. 8CTCh. 2 - Prob. 9CTCh. 2 - Prob. 10CTCh. 2 - Prob. 11CTCh. 2 - This is your second interview with a prestigious...Ch. 2 - Prob. 2DCCh. 2 - Prob. 3DCCh. 2 - Prob. 4DCCh. 2 - Prob. 5DCCh. 2 - Prob. 6DCCh. 2 - Prob. 7DCCh. 2 - Prob. 1PCh. 2 - Prob. 2PCh. 2 - Prob. 3PCh. 2 - Consider the following potential events that might...Ch. 2 - Prob. 5PCh. 2 - Use EDGAR (www.sec.gov) to find Qualcomm's 10K...Ch. 2 - Prob. 7PCh. 2 - Prob. 8PCh. 2 - Prob. 9PCh. 2 - Prob. 10PCh. 2 - Prob. 11PCh. 2 - Prob. 12PCh. 2 - Prob. 13PCh. 2 - Prob. 14PCh. 2 - Prob. 15PCh. 2 - Prob. 16PCh. 2 - Prob. 17PCh. 2 - Prob. 18PCh. 2 - Prob. 19PCh. 2 - In December 2015, Apple had cash of $38.07...Ch. 2 - Prob. 21PCh. 2 - Prob. 22PCh. 2 - Local co. has sales of $10 million and cost of $6...Ch. 2 - 24. If Local Co., the company in Problem 23, had...Ch. 2 - Prob. 25PCh. 2 - Prob. 26PCh. 2 - Prob. 27PCh. 2 - Prob. 28PCh. 2 - Prob. 29PCh. 2 - Prob. 30PCh. 2 - Prob. 31PCh. 2 - Prob. 32PCh. 2 - Prob. 33PCh. 2 - Prob. 34PCh. 2 - Prob. 35PCh. 2 - Prob. 36PCh. 2 - Some balance sheet information is shown here (all...Ch. 2 - Prob. 38P
Knowledge Booster


Learn more about
Need a deep-dive on the concept behind this application? Look no further. Learn more about this topic, finance and related others by exploring similar questions and additional content below.Similar questions
- The December 31, 2015, balance sheet of Schism, Inc., showed long-term debt of $1,730,000, and the December 31, 2016, balance sheet showed long-term debt of $1,420,000. The 2016 income statement showed an interest expense of $97,000. What was the firm's cash flow to creditors during 2016? (A negative answer should be indicated by a minus sign. Enter your answer in dollars, not millions of dollars, e.g., 1,234,567. Do not round intermediate calculations and round your answer to the nearest whole number, e.g., 32.)arrow_forwardPlease find below Financial Statement extracts of Nestle from year 2017 and 2018. Based on this information please answer following question from a perspective of Financial Analyst (justify your answers with data as well the reason for choosing your ratios for your analysis) .The company’s total assets at year-end 2016 were CHF 131,900 million. What reasonable conclusions an analyst might make about the companies efficiency, Companies solvency, Liquidity and Profitability? In millions of CHF Notes 2018 2017 * Sales 3 91,439 89,590 Cost of goods sold (46,070) (45,571) Trading operating profit 3 13,789 13,277 Operating profit 13,752 10,156 Profit before taxes, associates and joint ventures 12,991 9,460 Taxes 13 (3,439) (2,773) Profit for the year 10,468 7,511 Notes 2018 2017 * Assets Current assets Cash and cash equivalents 12/16…arrow_forwardYou are preparing pro forma financial statements for 2017 using the percent-of-sales method. Sales were $100,000 in 2016 and are projected to be $120,000 in 2017. Net income was $5,000 in 2016 and is projected to be $6,000 in 2017. Equity was $45,000 at year-end 2015 and $50,000 at year-end 2016. Assuming that this company never issues new equity, never repurchases equity, and never changes its dividend payout ratio, what would be projected for equity at year-end 2017?arrow_forward
- Based on this analysis how would I assess the financial stability and operational efficiency of this company? Ratio and Ratio Formula (in thousands) 2015 2014 2013 Current Industry Average Liquidity Current Ratio =Current Asset / Current Liability 9,900/6,300 1.57 1.61 1.62 1.63 Acid Test Ratio or Quick Ratio = (Cash + Marketable securities + Accounts receivable)/Current liabilities (400+300+3,200)/6,300 0.62 0.64 0.63 0.68 Solvency Times Interest Earned =Earnings before interest & taxes/interest expense, gross (7,060+900)/900 8.84 8.55 8.5 8.45 Profitability Profit margin on sales = net income/sales 7,060/30,500 14% 13.20% 12.10% 13.00% Productivity Asset turnover = sales/avg total assets 30,500/6,000+5,400)/2) 1.85 1.84 1.83 1.84 Inventory turnover = COGS/avg inv 17,600/ (6,000+5,400)/2) 3.09 3.17 3.21 3.18arrow_forwardThe following information is available for Tanaka Corporation. Compute earnings per share for 2018 and 2017 for Tanaka, and comment on the change. Tanaka's primary competitor, Browning Corporation, had earnings per share of $1 per share in 2018. Comment on the difference in the ratios of the two companies. (b) Compute the current ratio and debt to assets ratio for each year, and comment on the changes. (c) Compute free cash flow for each year, and comment on the changes. 2018 2017 Current assets $ 54,000 $ 36,000 Total assets 240,000 205,000 Current liabilities 22,000 30,000 Total liabilities 72,000 100,000 Net income 90,000 50,000 Net cash provided by operating activities 100,000 56,000 Preferred dividends 6,000 6,000 Common dividends 3,000 1,500 Expenditures on property, plant, and equipment 27,000 12,000 Shares outstanding at beginning of year 40,000 30,000 Shares outstanding…arrow_forwardIn December 2015, General Electric (GE) had a book value of equity of $98 billion, 9.4 billion shares outstanding, and a market price of $31 per share. GE also had cash of $102 billion, and total debt of $199 billion. a. What was GE’s market capitalization? What was GE’s market-to-book ratio? b. What was GE’s book debt-equity ratio? What was GE’s market debt-equity ratio? c. What was GE’s enterprise value? Some balance sheet information is shown below (all values in millions of dollars)arrow_forward
- The financial statements for Tyler Toys, Inc. are shown in the popup window: LOADING... . Calculate the debt ratio, times interest earned ratio, and cash coverage ratio for 2013 and 2014 for Tyler Toys. Should any of these ratios or the change in a ratio warrant concern for the managers of Tyler Toys or the shareholders? Tyler Toys, Inc. Income Statement for Years Ending December 31, 2013 and 2014 2014 2013 Revenue $14,146,575 $13,566,748 Cost of goods sold $-8,448,000 $-8,132,335 Selling, general, andadministrative expenses $-998,406 $-980,458 Depreciation $-1,497,529 $-1,471,013 EBIT $3,202,640 $2,982,942 Interest expense $-376,217 $-354,594 Taxes $-1,074,041 $-998,772 Net income $1,752,382 $1,629,576 Right-click on the table and select Copy to Clipboard and then right-click the highlighted texts in the popup dialogue box and select Copy in order to paste its…arrow_forwardCalculate the financial indicators of the firm Merck for the year 2018 and fill in the spaces marked in the table. Company Name: Year 2018 Chemicals and Allied Products Industry Ratios ………….. Solvency or Debt Ratios Merck J&J 2018 Debt ratio …. …. 0.47 Debt-to-equity ratio …. …. 0.38 Interest coverage ratio …. …. -9.43 Liquidity Ratios Current ratio …. …. 3.47 Quick ratio …. …. 2.12 Cash ratio …. …. 2.24 Profitability Ratios Profit margin …. …. -93.4% ROE (Return on equity), after tax …. …. -248.5 ROA (Return on assets) …. …. -146.5 Gross margin …. …. 55.3% Operating margin (Return on sales) …. …. -42.9% Activity or Efficiency Ratios Asset turnover …. …. 1.08 Receivables turnover (days) …. …. 16 Inventory turnover (days)…arrow_forwardKannan Carpets, Inc. has asked you to calculate the company's quick ratio for 2016. All you have is a partial balancesheet and some assumptions. Using the information provided, calculate Kannan's quick ratio for 2016. Gross profitmargin = 50%. Inventory turnover (COGS/Inv) = 5. 2001 sales = $3,000 Assets Liabilities & EquityCash ? Accounts payable $50AR $40 Accruals ?Inventory ? Long-term debt $400Net fixed assets $500 Equity 250Total assets $900 Total liab. & equity ?arrow_forward
- During 2022, Pronghorn Corp entered into the following transactions. 1. Borrowed $62,200 by issuing bonds. 2. Paid $8,890 cash dividend to stockholders. 3. Received $13,900 cash from a previously billed customer for services performed. 4. Purchased supplies on account for $5,000. Using the following tabular analysis, show the effect of each transaction on the accounting equation. (If a transaction causes a decrease in Assets, Liabilities or Stockholders' Equity, place a negative sign (or parentheses) in front of the amount entered for the particular Asset, Liability or Equity item that was reduced. See Illustration 3-4 for example.) Assets = Liabilities + Stockholders’ Equity Cash + Accounts Receivable + Supplies = Accounts Payable + Bonds Payable + Common Stock + Retained EarningsDividends (1) $enter a dollar amount $enter a dollar amount $enter a dollar amount $enter a dollar amount $enter a dollar amount…arrow_forwardCertain financial ratios for The Gap for its most recent year are given below, along with the average ratios for its industry. Based on those ratios, answer the following. 1) Does The Gap seem to prefer to finance its assets with debt or with equity? How can you tell? What percent of its assets are funded with debt? What percent of its assets are funded with equity? 2) A supplier to The Gap sells merchandise to The Gap and asks to be paid within 60 days. While any of The Gap’s financial ratios might be of interest to the supplier, which of the ratios listed below do you think would likely be the most important one to the supplier? Why? 3) Which of the ratios presented suggest that, compared to its industry, The Gap may have a problem controlling its operating expenses? How can you tell? Your answer should clearly indicate that you understand why the ratio that you chose answers this question. Here is the data for The Gap and its industry. Financial Ratios…arrow_forwardRATIO ANALYSIS The Corrigan Corporation's 2014 and 2015 financial statements follow, along with some industry average ratios. a. Assess Corrigan's liquidity position, and determine how itcompares with peers and how the liquidity position has changed over time.b. Assess Corrigan's asset management position, and determine how it compares with peers and how its asset management efficiency has changed over time.C. Assess Corrigan's debt management position, and determine how it compares with peers and how its debt management has changed over time.d. Assess Corrigan's profitability ratios, and determine how they compare with peers and how its profitability position has changed over time.e. Assess Corrigan's market value ratios, and determine how its valuation compares with peers and how it has changed over time.f. Calculate Corrigan's ROE as well as the industry average ROE, using the DuPont equation. From this analysis, how does Corrigan's financial position compare with the industry…arrow_forward
arrow_back_ios
SEE MORE QUESTIONS
arrow_forward_ios
Recommended textbooks for you
 EBK CONTEMPORARY FINANCIAL MANAGEMENTFinanceISBN:9781337514835Author:MOYERPublisher:CENGAGE LEARNING - CONSIGNMENT
 PFIN (with PFIN Online, 1 term (6 months) Printed...FinanceISBN:9781337117005Author:Randall Billingsley, Lawrence J. Gitman, Michael D. JoehnkPublisher:Cengage Learning
 Financial Accounting: The Impact on Decision Make...AccountingISBN:9781305654174Author:Gary A. Porter, Curtis L. NortonPublisher:Cengage Learning
EBK CONTEMPORARY FINANCIAL MANAGEMENT
Finance
ISBN:9781337514835
Author:MOYER
Publisher:CENGAGE LEARNING - CONSIGNMENT
PFIN (with PFIN Online, 1 term (6 months) Printed...
Finance
ISBN:9781337117005
Author:Randall Billingsley, Lawrence J. Gitman, Michael D. Joehnk
Publisher:Cengage Learning
Financial Accounting: The Impact on Decision Make...
Accounting
ISBN:9781305654174
Author:Gary A. Porter, Curtis L. Norton
Publisher:Cengage Learning
Financial ratio analysis; Author: The Finance Storyteller;https://www.youtube.com/watch?v=MTq7HuvoGck;License: Standard Youtube License