
Concept explainers
Videos
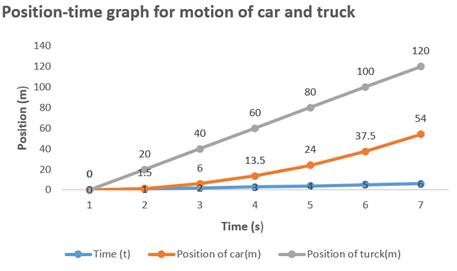
The position time graph for the car and truck for time
Explanation of Solution
Given info:
Car is at rest at time
Car is accelerating constantly at
At time
Formula used:
Formula to find the distance travelled in term of velocity and time is,
Another formula to find the distance travelled in term of speed and acceleration is,
Here,
To draw a position versus time graph we have to draw a table showing position of car from time
Find the position of car:
As car is starting from rest its initial velocity is zero. Finding the position of car using equation-2.
By changing the value of time in equation-3 from
| Time | |||||||
| Position of car ( ) |
Find the position of truck using equation-1.
By changing the value of time in equation-4 from
| Time | |||||||
| Position of car ( ) |
We draw position time graph by taking value of time on x-axis and position on y-axis.
The shape of position time graph for car is curve and for truck is a straight line.
Graph shows car is accreting from rest and truck is moving with constant velocity.
Conclusion:
Thus,the shape of position time graph for car is curve and for truck is straight line.
Graph shows car is accreting from rest and truck is moving with constant velocity.
Want to see more full solutions like this?
Chapter 2 Solutions
COLLEGE PHYSICS


- Is it possible for velocity to be constant while acceleration is not zero? Explain.arrow_forwardDiscuss whether or not the velocity of an object can reverse direction while maintaining a constant acceleration. If so, give an example; if not, provide an explanation.arrow_forwardCan an object have an acceleration of zero and a velocity that is not zero? Explain why or give an example. Can an object have a velocity of zero and an acceleration that is not zero? Explain why or give an example.arrow_forward
- Can you give several examples of an object's motion in which a great distance is traveled but the displacement is zero?arrow_forward. Is it possible for a body moving on a circular track to have zero acceleration? Explain vividly if Yes or Noarrow_forwardPlease assist with this question with details on how to do it. Thank you. Mayan kings and many school sports team are named for the puma, cougar, or mountain lion - felis concolor- the best jumper among animals. It can jump to a height of 12 ft when leaving the ground at an angle of 45 degrees. With the speed , in SI units, does it leave the ground to make this leap?arrow_forward
- Moving sidewalks are installed every other 50 meters along the entire stretch of an airport walkway. These sidewalks move at a constant speed of 1 m/s. A lady passenger takes one of the sidewalks to go from one point to the next. If the passenger decides to go back using the same sidewalk at 1 m/s, how long will it take to reach her point of origin?arrow_forwardDuring its motion (after it leaves the hand and before it returns), doesthe eraser ever have an instantaneous velocity of zero? Explainarrow_forwardIs it possible for an object to be at zero velocity when its acceleration is not zero? Explain with an examplearrow_forward
 Principles of Physics: A Calculus-Based TextPhysicsISBN:9781133104261Author:Raymond A. Serway, John W. JewettPublisher:Cengage Learning
 University Physics Volume 1PhysicsISBN:9781938168277Author:William Moebs, Samuel J. Ling, Jeff SannyPublisher:OpenStax - Rice University