Concept explainers
Videos
(a)
The sketch of speed – time graph.
(a)
Answer to Problem 54P
The sketch of speed – time graph of air plane is drawn.
Explanation of Solution
The below figure shows the speed time graph of the airplane.
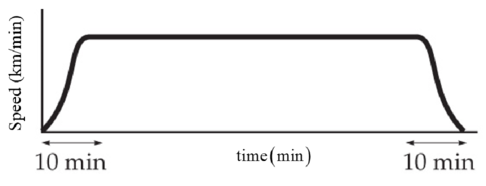
Airplane was initially at rest on the ground, accelerates quickly and gains its top speed in first 10 minutes and then it travels with constant speed and then while it lands off it decelerates quickly to the ground similar to the acceleration while taking off.
Conclusion:
The sketch of speed – time graph of air plane is drawn.
(b)
The average speed of the trip.
(b)
Answer to Problem 54P
The average speed of the trip is
Explanation of Solution
Write the expression to calculate the average speed.
Here,
Conclusion:
Substitute
Therefore, the average speed of the trip is
(c)
The top speed in the trip
(c)
Answer to Problem 54P
The top speed in the trip is
Explanation of Solution
For the first 10 min and last 10 min that is for a total of 20 min the average speed of the airplane was half the top speed. For the remaining time
Here,
Write the expression to calculate the total distance travelled by the airplane.
Here
Use
Conclusion:
Substitute
Therefore, the a top speed of the trip is
(d)
The average acceleration during first 10 min.
(d)
Answer to Problem 54P
The average acceleration during first 10 min is
Explanation of Solution
Write the expression for average acceleration during first 10 min.
Here,
Conclusion:
Substitute
Therefore, the average acceleration during first 10 min is
(e)
The average acceleration during the central hours of the trip.
(e)
Answer to Problem 54P
The average acceleration during the central hours of the trip is
Explanation of Solution
During the central hours of the trip, the airplane travelled with top speed. Top speed is constant and hence during the central hours of the trip the acceleration was zero.
Conclusion:
Therefore, the average acceleration during the central hours of the trip is
Want to see more full solutions like this?
Chapter 2 Solutions
College Physics, Volume 1


- (a) Can the equations in Table 2.4 be used in a situation where the acceleration varies with time? (b) Can they be used when the acceleration is zero? Table 2.4 Equations for Motion in a Straight Line Under Constant Acceleration Equation Information Given by Equation v = v0 + at velocity as a function of time x = v0t + 12at2 Displacement as a function of time v2 = v02 + 2ax Velocity as a function if displacement Note: Motion is along the x -axis. At t = 0, the velocity of the particle is varrow_forwardA commuter train travels between two downtown stations. Because the stations are only 1.00 km apart, the train never reaches its maximum possible cruising speed. During rush hour the engineer minimizes the time interval t between two stations by accelerating at a rate a1 = 0.100 m/s2 for a time interval t1 and then immediately braking with acceleration a2 = 0.500 m/s2 for a time interval t2. Find the minimum time interval of travel t and the time interval t1.arrow_forwardYou normally drive on a freeway between San Diego and Los Angeles at an average speed of 105 km/h, and the trip takes 2 h and 20 mins. On a Friday afternoon, however, heavy traffic slows you down and you drive the same distance at an average speed of only 70 km/h. How much longer does the trip take?arrow_forward
- If the graph of the velocity of an object as a function of time is a straight line, what can you conclude about the acceleration of the object is the slope is (a) positive, (b) negative, and (c) zero?arrow_forwardA race car starts from rest and travels east along a straight and level track. For the first 5.0 s of the car's motion, the eastward component of the car's velocity is given by υx(t)=(0.920m/s^3)t^2 What is the acceleration of the car when υx = 12.8 m/s ? Express your answer with the appropriate units.arrow_forwardCompute your average velocity in the following two cases: (a) You walk 64.0 m at a speed of 1.28 m/s and then run 64.0 m at a speed of 3.98 m/s along a straight track. (b) You walk for 1.00 min at a speed of 1.28 m/s and then run for 1.39 min at 3.98 m/s along a straight track.arrow_forward
- A Nozomi Shinkansen train at rest travels from Osaka to Tokyo along a high-speed railroad track which makes a total of 3-hour journey, non-stop. From Osaka station, its distance x is given as a function of time t by the equation x(t)=−αt2+βt3 where α=4.35mihr2 and β=13mihr3. Determine:a) The average and instantaneous velocity of the train as it reaches Tokyo in mph.b) The average and instantaneous acceleration of the train as it reaches Tokyo in mihr2.arrow_forwardSuppose an object starts at time t=0s at a position defined as x=0m. At t=0.5s, the object is at x=1.5m, and at t=1.0s, the object is at x=2.0m. What is the average velocity for the first interval (approximated at t=0.25s) and for the second interval (approximated at t=0.75s)? In the example above, what is the average acceleration of the object?arrow_forwardA train is traveling down a straight track at 32 m/s when the engineer applies the brakes, resulting in an acceleration of −1.0 m/s2 as long as the train is in motion. How far does the train move during a 64-s time interval starting at the instant the brakes are applied in meters?arrow_forward
- A train is traveling down a straight track at 20 m/s when the engineer applies the brakes, resulting in an acceleration of −1.0 m/s2 as long as the train is in motion. How far does the train move during a 40-s time interval starting at the instant the brakes are applied?arrow_forwardA cyclist, starting from rest, travels in a straight line for 1010 minutes. During the first 2.0 min2.0 min of her trip, she maintains a uniform acceleration of 0.067 m/s2.0.067 m/s2. She then travels at constant velocity for the next 5.0 min.5.0 min. Next, she decelerates at a constant rate so that she comes to rest 3.0 min3.0 min later. Create a graph of the cyclist's velocity versus time that closely approximates her trip. The individual events of the trip are represented by the dots at the bottom of the graph. Move each dot to the appropriate velocity.arrow_forwardA cyclist, starting from rest, travels in a straight line for 1010 minutes. During the first 2.0 min2.0 min of her trip, she maintains a uniform acceleration of 0.067 m/s2.0.067 m/s2. She then travels at constant velocity for the next 5.0 min.5.0 min. Next, she decelerates at a constant rate so that she comes to rest 3.0 min3.0 min later. Create a graph of the cyclist's velocity versus time that closely approximates her trip. The individual events of the trip are represented by the dots at the bottom of the graph. Move each dot to the appropriate velocity. Velocity (m/s)Time (min)012345678910-5-4-3-2-1012345678910 What is the acceleration ?lastalast during the last 3 min?arrow_forward
 College PhysicsPhysicsISBN:9781285737027Author:Raymond A. Serway, Chris VuillePublisher:Cengage Learning
 Principles of Physics: A Calculus-Based TextPhysicsISBN:9781133104261Author:Raymond A. Serway, John W. JewettPublisher:Cengage Learning