
b)
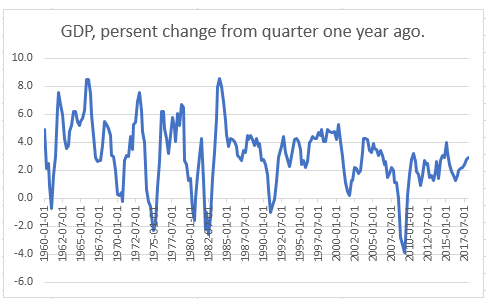
The graphical representation of quarterly growth rates of real
b)
Explanation of Solution
The data of quarterly growth rates of real GDP from 1960 to last year using the percent change from a year ago is as follows:
| Date | GDP, percentage change from quarter one year ago. |
| 1960-01-01 | 4.9 |
| 1960-04-01 | 2.1 |
| 1960-07-01 | 2.5 |
| 1960-10-01 | 0.9 |
| 1961-01-01 | -0.7 |
| 1961-04-01 | 1.6 |
| 1961-07-01 | 3.0 |
| 1961-10-01 | 6.4 |
| 1962-01-01 | 7.6 |
| 1962-04-01 | 6.7 |
| 1962-07-01 | 6.0 |
| 1962-10-01 | 4.3 |
| 1963-01-01 | 3.6 |
| 1963-04-01 | 3.8 |
| 1963-07-01 | 4.8 |
| 1963-10-01 | 5.2 |
| 1964-01-01 | 6.2 |
| 1964-04-01 | 6.2 |
| 1964-07-01 | 5.5 |
| 1964-10-01 | 5.2 |
| 1965-01-01 | 5.5 |
| 1965-04-01 | 5.7 |
| 1965-07-01 | 6.3 |
| 1965-10-01 | 8.5 |
| 1966-01-01 | 8.5 |
| 1966-04-01 | 7.5 |
| 1966-07-01 | 6.0 |
| 1966-10-01 | 4.5 |
| 1967-01-01 | 2.9 |
| 1967-04-01 | 2.6 |
| 1967-07-01 | 2.7 |
| 1967-10-01 | 2.7 |
| 1968-01-01 | 3.8 |
| 1968-04-01 | 5.5 |
| 1968-07-01 | 5.3 |
| 1968-10-01 | 5.0 |
| 1969-01-01 | 4.5 |
| 1969-04-01 | 3.1 |
| 1969-07-01 | 3.0 |
| 1969-10-01 | 2.0 |
| 1970-01-01 | 0.3 |
| 1970-04-01 | 0.2 |
| 1970-07-01 | 0.4 |
| 1970-10-01 | -0.2 |
| 1971-01-01 | 2.7 |
| 1971-04-01 | 3.1 |
| 1971-07-01 | 3.0 |
| 1971-10-01 | 4.4 |
| 1972-01-01 | 3.5 |
| 1972-04-01 | 5.3 |
| 1972-07-01 | 5.4 |
| 1972-10-01 | 6.9 |
| 1973-01-01 | 7.6 |
| 1973-04-01 | 6.3 |
| 1973-07-01 | 4.8 |
| 1973-10-01 | 4.0 |
| 1974-01-01 | 0.6 |
| 1974-04-01 | -0.2 |
| 1974-07-01 | -0.6 |
| 1974-10-01 | -1.9 |
| 1975-01-01 | -2.3 |
| 1975-04-01 | -1.8 |
| 1975-07-01 | 0.8 |
| 1975-10-01 | 2.6 |
| 1976-01-01 | 6.2 |
| 1976-04-01 | 6.2 |
| 1976-07-01 | 5.0 |
| 1976-10-01 | 4.3 |
| 1977-01-01 | 3.2 |
| 1977-04-01 | 4.5 |
| 1977-07-01 | 5.8 |
| 1977-10-01 | 5.0 |
| 1978-01-01 | 4.1 |
| 1978-04-01 | 6.1 |
| 1978-07-01 | 5.2 |
| 1978-10-01 | 6.7 |
| 1979-01-01 | 6.5 |
| 1979-04-01 | 2.7 |
| 1979-07-01 | 2.4 |
| 1979-10-01 | 1.3 |
| 1980-01-01 | 1.4 |
| 1980-04-01 | -0.8 |
| 1980-07-01 | -1.6 |
| 1980-10-01 | 0.0 |
| 1981-01-01 | 1.6 |
| 1981-04-01 | 3.0 |
| 1981-07-01 | 4.3 |
| 1981-10-01 | 1.3 |
| 1982-01-01 | -2.2 |
| 1982-04-01 | -1.0 |
| 1982-07-01 | -2.6 |
| 1982-10-01 | -1.4 |
| 1983-01-01 | 1.4 |
| 1983-04-01 | 3.3 |
| 1983-07-01 | 5.7 |
| 1983-10-01 | 7.9 |
| 1984-01-01 | 8.6 |
| 1984-04-01 | 8.0 |
| 1984-07-01 | 6.9 |
| 1984-10-01 | 5.6 |
| 1985-01-01 | 4.6 |
| 1985-04-01 | 3.7 |
| 1985-07-01 | 4.3 |
| 1985-10-01 | 4.2 |
| 1986-01-01 | 4.1 |
| 1986-04-01 | 3.7 |
| 1986-07-01 | 3.1 |
| 1986-10-01 | 2.9 |
| 1987-01-01 | 2.7 |
| 1987-04-01 | 3.4 |
| 1987-07-01 | 3.3 |
| 1987-10-01 | 4.5 |
| 1988-01-01 | 4.2 |
| 1988-04-01 | 4.5 |
| 1988-07-01 | 4.2 |
| 1988-10-01 | 3.8 |
| 1989-01-01 | 4.3 |
| 1989-04-01 | 3.7 |
| 1989-07-01 | 3.9 |
| 1989-10-01 | 2.7 |
| 1990-01-01 | 2.8 |
| 1990-04-01 | 2.4 |
| 1990-07-01 | 1.7 |
| 1990-10-01 | 0.6 |
| 1991-01-01 | -1.0 |
| 1991-04-01 | -0.5 |
| 1991-07-01 | -0.1 |
| 1991-10-01 | 1.2 |
| 1992-01-01 | 2.9 |
| 1992-04-01 | 3.2 |
| 1992-07-01 | 3.7 |
| 1992-10-01 | 4.4 |
| 1993-01-01 | 3.3 |
| 1993-04-01 | 2.8 |
| 1993-07-01 | 2.3 |
| 1993-10-01 | 2.6 |
| 1994-01-01 | 3.4 |
| 1994-04-01 | 4.2 |
| 1994-07-01 | 4.3 |
| 1994-10-01 | 4.1 |
| 1995-01-01 | 3.5 |
| 1995-04-01 | 2.4 |
| 1995-07-01 | 2.7 |
| 1995-10-01 | 2.2 |
| 1996-01-01 | 2.6 |
| 1996-04-01 | 4.0 |
| 1996-07-01 | 4.1 |
| 1996-10-01 | 4.4 |
| 1997-01-01 | 4.3 |
| 1997-04-01 | 4.3 |
| 1997-07-01 | 4.7 |
| 1997-10-01 | 4.5 |
| 1998-01-01 | 4.9 |
| 1998-04-01 | 4.1 |
| 1998-07-01 | 4.1 |
| 1998-10-01 | 4.9 |
| 1999-01-01 | 4.8 |
| 1999-04-01 | 4.7 |
| 1999-07-01 | 4.7 |
| 1999-10-01 | 4.8 |
| 2000-01-01 | 4.2 |
| 2000-04-01 | 5.3 |
| 2000-07-01 | 4.1 |
| 2000-10-01 | 3.0 |
| 2001-01-01 | 2.3 |
| 2001-04-01 | 1.1 |
| 2001-07-01 | 0.5 |
| 2001-10-01 | 0.2 |
| 2002-01-01 | 1.3 |
| 2002-04-01 | 1.3 |
| 2002-07-01 | 2.2 |
| 2002-10-01 | 2.1 |
| 2003-01-01 | 1.8 |
| 2003-04-01 | 2.0 |
| 2003-07-01 | 3.3 |
| 2003-10-01 | 4.3 |
| 2004-01-01 | 4.3 |
| 2004-04-01 | 4.2 |
| 2004-07-01 | 3.4 |
| 2004-10-01 | 3.3 |
| 2005-01-01 | 3.9 |
| 2005-04-01 | 3.6 |
| 2005-07-01 | 3.5 |
| 2005-10-01 | 3.1 |
| 2006-01-01 | 3.4 |
| 2006-04-01 | 3.1 |
| 2006-07-01 | 2.4 |
| 2006-10-01 | 2.6 |
| 2007-01-01 | 1.5 |
| 2007-04-01 | 1.8 |
| 2007-07-01 | 2.2 |
| 2007-10-01 | 2.0 |
| 2008-01-01 | 1.1 |
| 2008-04-01 | 1.1 |
| 2008-07-01 | 0.0 |
| 2008-10-01 | -2.8 |
| 2009-01-01 | -3.3 |
| 2009-04-01 | -3.9 |
| 2009-07-01 | -3.0 |
| 2009-10-01 | 0.2 |
| 2010-01-01 | 1.7 |
| 2010-04-01 | 2.8 |
| 2010-07-01 | 3.2 |
| 2010-10-01 | 2.6 |
| 2011-01-01 | 1.9 |
| 2011-04-01 | 1.7 |
| 2011-07-01 | 0.9 |
| 2011-10-01 | 1.6 |
| 2012-01-01 | 2.7 |
| 2012-04-01 | 2.4 |
| 2012-07-01 | 2.5 |
| 2012-10-01 | 1.5 |
| 2013-01-01 | 1.6 |
| 2013-04-01 | 1.3 |
| 2013-07-01 | 1.9 |
| 2013-10-01 | 2.6 |
| 2014-01-01 | 1.4 |
| 2014-04-01 | 2.7 |
| 2014-07-01 | 3.1 |
| 2014-10-01 | 2.9 |
| 2015-01-01 | 4.0 |
| 2015-04-01 | 3.3 |
| 2015-07-01 | 2.4 |
| 2015-10-01 | 1.9 |
| 2016-01-01 | 1.6 |
| 2016-04-01 | 1.3 |
| 2016-07-01 | 1.6 |
| 2016-10-01 | 2.0 |
| 2017-01-01 | 2.1 |
| 2017-04-01 | 2.2 |
| 2017-07-01 | 2.4 |
| 2017-10-01 | 2.8 |
| 2018-01-01 | 2.9 |
c)
The graphical representation of quarterly growth rates of real GDP from 1960 to last year using the percent change from preceding period quarterly. To ascertain the least volatile and most volatile measure, and the differences between these three series.
c)
Explanation of Solution
The data of quarterly growth rates of real GDP from 1960 to last year using the percent change from preceding period quarterly is as follows:
| Date | GDP percent change from preceding period, quarterly |
| 1960-04-01 | -2.1 |
| 1960-07-01 | 2.0 |
| 1960-10-01 | -5.0 |
| 1961-01-01 | 2.7 |
| 1961-04-01 | 7.0 |
| 1961-07-01 | 7.9 |
| 1961-10-01 | 8.1 |
| 1962-01-01 | 7.3 |
| 1962-04-01 | 3.7 |
| 1962-07-01 | 5.0 |
| 1962-10-01 | 1.3 |
| 1963-01-01 | 4.4 |
| 1963-04-01 | 4.6 |
| 1963-07-01 | 9.1 |
| 1963-10-01 | 2.6 |
| 1964-01-01 | 8.7 |
| 1964-04-01 | 4.4 |
| 1964-07-01 | 6.4 |
| 1964-10-01 | 1.2 |
| 1965-01-01 | 10.0 |
| 1965-04-01 | 5.1 |
| 1965-07-01 | 9.2 |
| 1965-10-01 | 9.5 |
| 1966-01-01 | 10.1 |
| 1966-04-01 | 1.4 |
| 1966-07-01 | 3.4 |
| 1966-10-01 | 3.3 |
| 1967-01-01 | 3.6 |
| 1967-04-01 | 0.2 |
| 1967-07-01 | 3.8 |
| 1967-10-01 | 3.0 |
| 1968-01-01 | 8.4 |
| 1968-04-01 | 6.9 |
| 1968-07-01 | 3.1 |
| 1968-10-01 | 1.6 |
| 1969-01-01 | 6.4 |
| 1969-04-01 | 1.2 |
| 1969-07-01 | 2.7 |
| 1969-10-01 | -1.9 |
| 1970-01-01 | -0.6 |
| 1970-04-01 | 0.6 |
| 1970-07-01 | 3.7 |
| 1970-10-01 | -4.2 |
| 1971-01-01 | 11.3 |
| 1971-04-01 | 2.2 |
| 1971-07-01 | 3.3 |
| 1971-10-01 | 0.9 |
| 1972-01-01 | 7.6 |
| 1972-04-01 | 9.4 |
| 1972-07-01 | 3.8 |
| 1972-10-01 | 6.9 |
| 1973-01-01 | 10.3 |
| 1973-04-01 | 4.4 |
| 1973-07-01 | -2.1 |
| 1973-10-01 | 3.8 |
| 1974-01-01 | -3.4 |
| 1974-04-01 | 1.0 |
| 1974-07-01 | -3.7 |
| 1974-10-01 | -1.5 |
| 1975-01-01 | -4.8 |
| 1975-04-01 | 2.9 |
| 1975-07-01 | 7.0 |
| 1975-10-01 | 5.5 |
| 1976-01-01 | 9.3 |
| 1976-04-01 | 3.0 |
| 1976-07-01 | 2.2 |
| 1976-10-01 | 2.9 |
| 1977-01-01 | 4.8 |
| 1977-04-01 | 8.0 |
| 1977-07-01 | 7.4 |
| 1977-10-01 | 0.0 |
| 1978-01-01 | 1.3 |
| 1978-04-01 | 16.4 |
| 1978-07-01 | 4.1 |
| 1978-10-01 | 5.5 |
| 1979-01-01 | 0.7 |
| 1979-04-01 | 0.4 |
| 1979-07-01 | 3.0 |
| 1979-10-01 | 1.0 |
| 1980-01-01 | 1.3 |
| 1980-04-01 | -8.0 |
| 1980-07-01 | -0.5 |
| 1980-10-01 | 7.7 |
| 1981-01-01 | 8.1 |
| 1981-04-01 | -2.9 |
| 1981-07-01 | 4.9 |
| 1981-10-01 | -4.3 |
| 1982-01-01 | -6.1 |
| 1982-04-01 | 1.8 |
| 1982-07-01 | -1.5 |
| 1982-10-01 | 0.2 |
| 1983-01-01 | 5.4 |
| 1983-04-01 | 9.4 |
| 1983-07-01 | 8.2 |
| 1983-10-01 | 8.6 |
| 1984-01-01 | 8.1 |
| 1984-04-01 | 7.1 |
| 1984-07-01 | 3.9 |
| 1984-10-01 | 3.3 |
| 1985-01-01 | 3.9 |
| 1985-04-01 | 3.6 |
| 1985-07-01 | 6.2 |
| 1985-10-01 | 3.0 |
| 1986-01-01 | 3.8 |
| 1986-04-01 | 1.8 |
| 1986-07-01 | 3.9 |
| 1986-10-01 | 2.2 |
| 1987-01-01 | 3.0 |
| 1987-04-01 | 4.4 |
| 1987-07-01 | 3.5 |
| 1987-10-01 | 7.0 |
| 1988-01-01 | 2.1 |
| 1988-04-01 | 5.4 |
| 1988-07-01 | 2.4 |
| 1988-10-01 | 5.4 |
| 1989-01-01 | 4.1 |
| 1989-04-01 | 3.1 |
| 1989-07-01 | 3.0 |
| 1989-10-01 | 0.8 |
| 1990-01-01 | 4.4 |
| 1990-04-01 | 1.5 |
| 1990-07-01 | 0.3 |
| 1990-10-01 | -3.6 |
| 1991-01-01 | -1.9 |
| 1991-04-01 | 3.2 |
| 1991-07-01 | 2.0 |
| 1991-10-01 | 1.4 |
| 1992-01-01 | 4.9 |
| 1992-04-01 | 4.4 |
| 1992-07-01 | 4.0 |
| 1992-10-01 | 4.2 |
| 1993-01-01 | 0.7 |
| 1993-04-01 | 2.3 |
| 1993-07-01 | 1.9 |
| 1993-10-01 | 5.6 |
| 1994-01-01 | 3.9 |
| 1994-04-01 | 5.5 |
| 1994-07-01 | 2.4 |
| 1994-10-01 | 4.7 |
| 1995-01-01 | 1.4 |
| 1995-04-01 | 1.2 |
| 1995-07-01 | 3.5 |
| 1995-10-01 | 2.7 |
| 1996-01-01 | 3.0 |
| 1996-04-01 | 6.8 |
| 1996-07-01 | 3.6 |
| 1996-10-01 | 4.2 |
| 1997-01-01 | 2.6 |
| 1997-04-01 | 6.8 |
| 1997-07-01 | 5.1 |
| 1997-10-01 | 3.5 |
| 1998-01-01 | 4.1 |
| 1998-04-01 | 3.8 |
| 1998-07-01 | 5.1 |
| 1998-10-01 | 6.6 |
| 1999-01-01 | 3.8 |
| 1999-04-01 | 3.1 |
| 1999-07-01 | 5.3 |
| 1999-10-01 | 7.0 |
| 2000-01-01 | 1.5 |
| 2000-04-01 | 7.5 |
| 2000-07-01 | 0.5 |
| 2000-10-01 | 2.5 |
| 2001-01-01 | -1.1 |
| 2001-04-01 | 2.4 |
| 2001-07-01 | -1.7 |
| 2001-10-01 | 1.1 |
| 2002-01-01 | 3.5 |
| 2002-04-01 | 2.4 |
| 2002-07-01 | 1.8 |
| 2002-10-01 | 0.6 |
| 2003-01-01 | 2.2 |
| 2003-04-01 | 3.5 |
| 2003-07-01 | 7.0 |
| 2003-10-01 | 4.7 |
| 2004-01-01 | 2.2 |
| 2004-04-01 | 3.1 |
| 2004-07-01 | 3.8 |
| 2004-10-01 | 4.1 |
| 2005-01-01 | 4.5 |
| 2005-04-01 | 1.9 |
| 2005-07-01 | 3.6 |
| 2005-10-01 | 2.6 |
| 2006-01-01 | 5.4 |
| 2006-04-01 | 0.9 |
| 2006-07-01 | 0.6 |
| 2006-10-01 | 3.5 |
| 2007-01-01 | 0.9 |
| 2007-04-01 | 2.3 |
| 2007-07-01 | 2.2 |
| 2007-10-01 | 2.5 |
| 2008-01-01 | -2.3 |
| 2008-04-01 | 2.1 |
| 2008-07-01 | -2.1 |
| 2008-10-01 | -8.4 |
| 2009-01-01 | -4.4 |
| 2009-04-01 | -0.6 |
| 2009-07-01 | 1.5 |
| 2009-10-01 | 4.5 |
| 2010-01-01 | 1.5 |
| 2010-04-01 | 3.7 |
| 2010-07-01 | 3.0 |
| 2010-10-01 | 2.0 |
| 2011-01-01 | -1.0 |
| 2011-04-01 | 2.9 |
| 2011-07-01 | -0.1 |
| 2011-10-01 | 4.7 |
| 2012-01-01 | 3.2 |
| 2012-04-01 | 1.7 |
| 2012-07-01 | 0.5 |
| 2012-10-01 | 0.5 |
| 2013-01-01 | 3.6 |
| 2013-04-01 | 0.5 |
| 2013-07-01 | 3.2 |
| 2013-10-01 | 3.2 |
| 2014-01-01 | -1.1 |
| 2014-04-01 | 5.5 |
| 2014-07-01 | 5.0 |
| 2014-10-01 | 2.3 |
| 2015-01-01 | 3.2 |
| 2015-04-01 | 3.0 |
| 2015-07-01 | 1.3 |
| 2015-10-01 | 0.1 |
| 2016-01-01 | 2.0 |
| 2016-04-01 | 1.9 |
| 2016-07-01 | 2.2 |
| 2016-10-01 | 2.0 |
| 2017-01-01 | 2.3 |
| 2017-04-01 | 2.2 |
| 2017-07-01 | 3.2 |
| 2017-10-01 | 3.5 |
| 2018-01-01 | 2.5 |
| 2018-04-01 | 3.5 |
The graphical representation of the quarterly growth rates of real GDP from 1960 to 2018 using the percent change from the previous quarter is as follows:
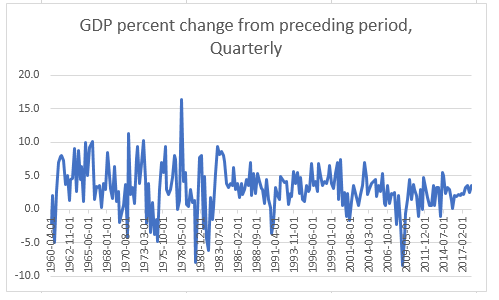
The quarterly percent change at the annual rate indicates the percent change, if the quarterly rate goes on for four quarters. It is calculated by compounding of quarterly rate for four quarters.
For some unpredictable quarterly series, percentage changes at quarterly rates rather than at annual rates are preferred because the question of comparability is less relevant and because the annual rate of change is smaller.
When these three data and their respective graph compare to each other for some specific successive period of time, following result is determined:
- 2nd one that is, GDP growth rate using percentage change from quarter one year ago is most volatile and 3rd way that is, GDP growth rate by using percent change from preceding period quarterly is least volatile.
Want to see more full solutions like this?
Chapter 2 Solutions
Macroeconomics

- Refer to the statement below and answer the following questions: Chief statistician Datuk Seri Dr Mohd Uzir Mahidin said Malaysia is expected to continue recording a slower economic growth in 2Q 2020 due to the Covid-19 pandemic, based on the near-term economic direction portrayed by the Leading Index (LI) for the reference month of February 2020. Mohd Uzir said GDP growth for 1Q 2020, meanwhile, was dragged by negative growth across all sectors except for services and manufacturing which grew 3.1% and 1.5% respectively. "Private final consumption expenditure in this quarter was on essential products such as food and non-alcoholic beverage, communication and housing, water, electricity and other fuels," he said in a statement on Malaysia's economic performance in 1Q 2020, today. He added that the Movement Control Order (MCO), which began on March 18, has resulted in lower household expenditure, which in turn, directly affected the industries related to food and beverage,…arrow_forwardRead the following extract and answer questions?South Africa’s economy grew by 1.1% in the first quarter of the year Stats SA has published the latest gross domestic product (GDP) data covering the first quarter of the year, showing that the economy grew by 1.1% in the first three months of 2021.The growth follows a revised 1.4% rise in real GDP in the fourth quarter of 2020. On an annualised basis, theeconomy grew 4.6% quarter-on-quarter. Following confusion caused by the annualisation of GDP data in 2020 – amid the Covid-19 pandemic andresulting lockdowns – Stats SA said it would no longer use the annualised data as the headline GDP statistic. During periods of steady economic growth, annualising is a useful way of expressing quarter-on-quarterperformance in annual terms, Stats SA said. However, during periods of economic instability, annualising can be misleading, because it exaggerates growth rates that are unlikely to be repeated. Given the information about the South African…arrow_forwardMacroeconomics is concerned with: only long-run trends in economic activity. only short-run fluctuations in the business cycle. both long-run trends and short-term fluctuations in economic activity. only with changes in the overall price level.arrow_forward
- Macroeconomists are interested in two types of phenomena: economic growth and business cycles. Explain with comprehensive how macroeconomists manipulate economic data in order to study these two problems.arrow_forwardExplain why the growth rate in GDP in current prices does not provide information about how quickly the economy is really growing.arrow_forwardEconomic variables are sometimes divided into “leading indicators” and “lagging indicators.” Leading indicators are variables that start to change before an economic expansion or contraction. Lagging indicators change only when an expansion or contraction is well underway. Based on the graph of the unemployment rate, is unemployment a leading or lagging indicator of recessions? Explain. How can we use this information when providing advice to a company that sells goods to consumers?arrow_forward
- Suppose you are interested in isolating the cyclical component of a macroeconomic time series (such as GDP ). Give at least one reason why assuming a non linear trend would be preferable than assuming a linear trend.arrow_forwardPlot these data points, and identify the four phases of the business cycle. Give a theory that may explain the cause of the observed business cycle. What are some of the consequences of a prolonged decline in real GDP? Is the decline in real GDP from $1,000 billion to $500 billion a recession?arrow_forwardWhat is the relationship between the business cycle and economic growth, and how do government policies aim to manage economic fluctuations?A) The business cycle has no connection to economic growth, and government policies have no impact on fluctuations.B) The business cycle represents the periodic expansion and contraction of economic activity, and government policies, such as fiscal and monetary measures, aim to mitigate the negative effects of economic downturns and support long-term growth.C) The business cycle is solely influenced by consumer spending.D) Government policies only exacerbate economic fluctuations.arrow_forward
- What common rule of thumb do economists use to define a recession? A decline of 5% in GDP A decline of 10% in GDP One quarter of negative GDP growth Two quarters (six months)of negative GDP growtharrow_forwardUse the blue points (circle symbol) to plot the real GDP in each of the years listed. (Note: Plot your points in the order in which you would like them connected. Line segments will connect the points automatically.) Next, place the black point (plus symbol) on the graph to indicate the point on the real GDP curve that definitely represents a peak. Finally, place the grey point (star symbol) on the graph to indicate the point on the real GDP curve that definitely represents a trough.arrow_forwardHow does the decline in real personal income compare today with prior recessions?arrow_forward


