
Concept explainers
Videos
The owner of a restaurant that services Continental-style entries has the business objective of learning more about the patterns of patron demand during the Friday-to-Sunday weekend time period. Data were collected from 630 customer on the type of entrée ordered and were organized in the following table (and stored in Entrée):
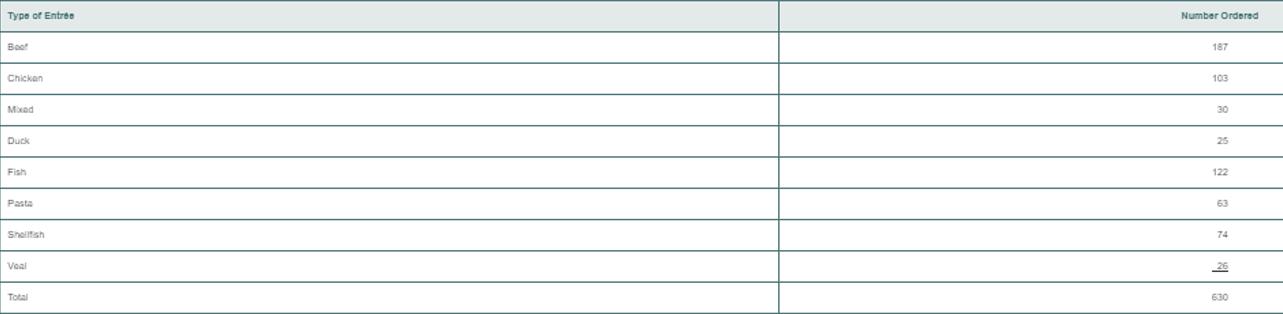
a. Construct a percentage summary table for the types of entrees ordered.
b. Construct a bar chart, a pie chart, doughnut, chart, and a Pareto chart for the types of entrees ordered.
c. Do you prefer using a Pareto chart or a pie chart for these data? Why?
d. What conclusions can the restaurant owner reach concerning demand for different types of entrees?
Want to see the full answer?
Check out a sample textbook solution
Chapter 2 Solutions
Basic Business Statistics Student Value Edition Plus NEW MyLab Statistics with Pearson eText -- Access Card Package (13th Edition)


 Glencoe Algebra 1, Student Edition, 9780079039897...AlgebraISBN:9780079039897Author:CarterPublisher:McGraw Hill
 Holt Mcdougal Larson Pre-algebra: Student Edition...AlgebraISBN:9780547587776Author:HOLT MCDOUGALPublisher:HOLT MCDOUGAL
 Big Ideas Math A Bridge To Success Algebra 1: Stu...AlgebraISBN:9781680331141Author:HOUGHTON MIFFLIN HARCOURTPublisher:Houghton Mifflin Harcourt