
Videos
For this problem, use the following payoff table:

a. Construct an opportunity loss table.
b. Construct a decision tree.
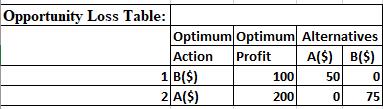
a.
Make an opportunity table using the given payoff table.
Explanation of Solution
The payoff table is given.
Use Excel to construct an opportunity loss table.
Software procedure:
The step-by-step procedure to make an opportunity loss table is given below.
Select Add-Ins > PHStat > Decision-Making > Opportunity Loss.
In the opportunity loss dialog, fill Number of Events as 2 and Number of Alternative Actions as 2.
Click OK.
In the template generated by Excel, fill the payoff table as given in the problem.
The excel output for opportunity loss table is shown below.
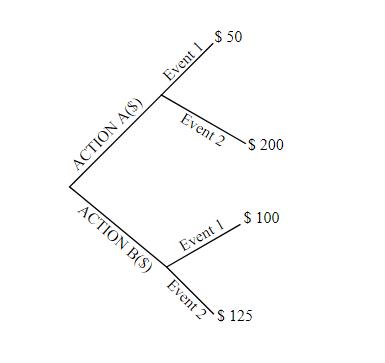
b.
Construct a decision tree for the given payoff table.
Explanation of Solution
The tree diagram for the given payoff table is given below.
Want to see more full solutions like this?
Chapter 20 Solutions
Basic Business Statistics, Student Value Edition (13th Edition)


- If you are interested in how well students perform on a standardized math-achievement test after they have completed a six-week math unit in either a computer-assisted class, a videotaped course, or a regular classroom, what kind of design do you have?arrow_forwardAssuming the market research was done properly and the 40% is representative, how many sales are expected if the publisher attempts to sell to 5,000 homes?arrow_forwardIdentify the data collection method used in the following statements: A researcher investigates the influence of online payments on consumer spending. A local TV network asked the voters to indicate whom they voted as they exited the polling booth. The school administration asked the students whether they are willing to have an increase in laboratory fees if there is an upgrade of computers. A social welfare organization gathers information on hospital patients with mental disorders. An investigator uses information from various business reports for analysis.arrow_forward
- given the data presented in the table, calculate the effect measures and answer the following questions D) if the data are from a cohort study, which is the best effect measure to report? Provide a rationale. - Odds Ratio - Risk Ratio Rationale: E) Calculate each of the following. Graph and label each measure. 1: Risk in the Exposed (Rexp) =2: Risk in the Exposed (Rexp) =3: population Attributable Risk (PAR) =arrow_forwardFrom the Research Question below please provide a list of semi-structured questions to be used in conducting an questionnaire. What are the perceptions of public servants of the recruitment, selection and retention policies and practices in the public service of Monserrat?arrow_forwardA researcher wants to determine if there is a relationship between income earned by siblings and birth order in families of three siblings. What type of study must the researcher use in this situation? A.experimental B.observationalarrow_forward
- The following table presents prices, in thousands of dollars, of single-family homes for 20 of the largest metropolitan areas in the United States for the first quarter of 2012 and the first quarter of 2013. . Metro Area 2012 2013 Boston, MA 311.5 332.2 Chicago, IL 157.2 159.4 Cincinnati, OH 112.5 121.0 Cleveland, OH 84.9 101.0 Dallas, TX 148.2 160.4 Denver, CO 226.4 261.2 Houston, TX 152.1 163.7 Los Angeles, CA 122.1 155.1 Miami, FL 182.0 219.9 Minneapolis, MN 147.3 170.6 Metro Area 2012 2013 New York, NY 363.8 368.2 Philadelphia, PA 193.5 197.7 Phoenix, AZ 129.9 169.0 Portland, OR 208.6 246.5 Riverside, CA 174.3 216.7 St. Louis, MO 103.7 111.0 San Diego, CA 359.5 412.3 San Francisco, CA 448.0…arrow_forwardIn how many ways can an investor select five mutual funds for his investment portfolio from a recommended list of nine mutual funds?arrow_forwardAre the following answers correct? Question: The American Association of Individual Investors (AAII) On-Line Discount Broker Survey polls members on their experiences with electronic trades handled by discount brokers. As part of the survey, members were asked to rate their satisfaction with the trade price and the speed of execution, as well as provide an overall satisfaction rating. Possible responses (scores) were no opinion (0), unsatisfied (1), somewhat satisfied (2), satisfied (3), and very satisfied (4). For each broker, summary scores were computed by computing a weighted average of the scores provided by each respondent. A portion the survey results follow (AAII web site, February 7, 2012). Brokerage Satisfaction withTrade Price Satisfaction withSpeed of Execution Overall Satisfaction withElectronic Trades Scottrade, Inc. 3.4 3.4 3.5 Charles Schwab 3.2 3.3 3.4 Fidelity Brokerage Services 3.1 3.4 3.9 TD Ameritrade 2.9 3.6 3.7 E*Trade Financial 2.9 3.2 2.9 (Not…arrow_forward
- In how many ways can an investor select four mutual funds for his investment portfolio from a recommended list of nine mutual funds?arrow_forwardFor the year 2017, 90% adults in the U.S. population aged 25 and older had completed high school. The attainment of a bachelor’s degree or higher for the same population stood at 34%. Assuming, that one must complete their high school before studying for their bachelor's, with H denoting those who have completed high school and B those who have completed their bachelors, draw a decision tree to help you find the following: P(H) (B|H) P (H and B) P (Hand B’) Source: High School Completion Rate Is Highest in U.S. Historyarrow_forwardMajor league baseball did not have any black players until Jackie Robinson broke the color line in 1947, even though there was no doubt that black athletes had the requisite playing skills. Was this most likely to be indicative of employer, employee, consumer, or statistical discrimination?arrow_forward
 MATLAB: An Introduction with ApplicationsStatisticsISBN:9781119256830Author:Amos GilatPublisher:John Wiley & Sons Inc
 Probability and Statistics for Engineering and th...StatisticsISBN:9781305251809Author:Jay L. DevorePublisher:Cengage Learning
 Statistics for The Behavioral Sciences (MindTap C...StatisticsISBN:9781305504912Author:Frederick J Gravetter, Larry B. WallnauPublisher:Cengage Learning
 Elementary Statistics: Picturing the World (7th E...StatisticsISBN:9780134683416Author:Ron Larson, Betsy FarberPublisher:PEARSON
 The Basic Practice of StatisticsStatisticsISBN:9781319042578Author:David S. Moore, William I. Notz, Michael A. FlignerPublisher:W. H. Freeman
 Introduction to the Practice of StatisticsStatisticsISBN:9781319013387Author:David S. Moore, George P. McCabe, Bruce A. CraigPublisher:W. H. Freeman