The wage gap is used to compare the status of women’s earnings relative to men’s. The wage gap is expressed as a percent and is calculated by dividing the median, or middlemost, annual earnings for women by the median annual earnings for men. The bar graph shows the wage gap for selected years from 1980 through 2010. Source: Bureau of Labor Statistics The function G ( x ) = −0.01 x 2 + x + 60 models the wage gap, as a percent, x years after 1980. The graph of function G is shown to the right of the actual data. Use this information to solve Exercises 103–104. 104. a. Find and interpret G (10). Identify this information as a point on the graph of the function. b. Does G (10) overestimate or underestimate the actual data shown by the bar graph? By how much?
The wage gap is used to compare the status of women’s earnings relative to men’s. The wage gap is expressed as a percent and is calculated by dividing the median, or middlemost, annual earnings for women by the median annual earnings for men. The bar graph shows the wage gap for selected years from 1980 through 2010. Source: Bureau of Labor Statistics The function G ( x ) = −0.01 x 2 + x + 60 models the wage gap, as a percent, x years after 1980. The graph of function G is shown to the right of the actual data. Use this information to solve Exercises 103–104. 104. a. Find and interpret G (10). Identify this information as a point on the graph of the function. b. Does G (10) overestimate or underestimate the actual data shown by the bar graph? By how much?
Solution Summary: The author analyzes how the functional value of G(x) represents the wage gap, as a percent, for the x years after 1980.
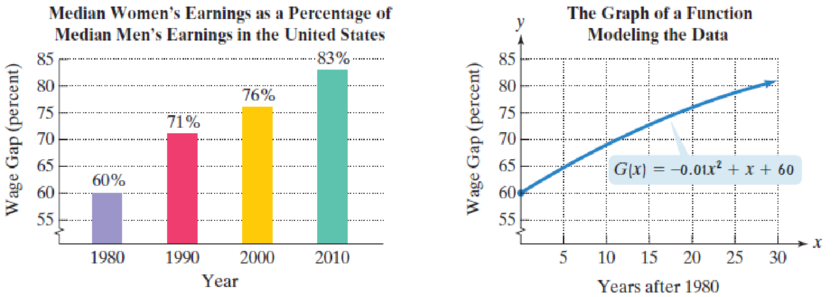
The wage gap is used to compare the status of women’s earnings relative to men’s. The wage gap is expressed as a percent and is calculated by dividing the median, or middlemost, annual earnings for women by the median annual earnings for men. The bar graph shows the wage gap for selected years from 1980 through 2010.
Source: Bureau of Labor Statistics
The function G(x) = −0.01x2 + x + 60 models the wage gap, as a percent, x years after 1980. The graph of function G is shown to the right of the actual data. Use this information to solve Exercises 103–104.
104. a. Find and interpret G(10). Identify this information as a point on the graph of the function.
b. Does G(10) overestimate or underestimate the actual data shown by the bar graph? By how much?
Need a deep-dive on the concept behind this application? Look no further. Learn more about this topic, algebra and related others by exploring similar questions and additional content below.


 Glencoe Algebra 1, Student Edition, 9780079039897...AlgebraISBN:9780079039897Author:CarterPublisher:McGraw Hill
 Algebra: Structure And Method, Book 1AlgebraISBN:9780395977224Author:Richard G. Brown, Mary P. Dolciani, Robert H. Sorgenfrey, William L. ColePublisher:McDougal Littell
 Holt Mcdougal Larson Pre-algebra: Student Edition...AlgebraISBN:9780547587776Author:HOLT MCDOUGALPublisher:HOLT MCDOUGAL
 Big Ideas Math A Bridge To Success Algebra 1: Stu...AlgebraISBN:9781680331141Author:HOUGHTON MIFFLIN HARCOURTPublisher:Houghton Mifflin Harcourt