
Introduction:
Break-even point in terms of sales units: The break-even point in sales units is the company’s fixed costs divided by the contribution margin of the company. Here, the contribution margin of the company is the selling price less the variable cost.
Break-even point in terms of sales dollars: The break-even point in sales dollars is the company’s fixed costs divided by the contribution margin ratio of the company. Here, the contribution margin of the company is the selling price less the variable cost. And the contribution margin ratio of the company is the contribution margin divided by the selling price.
CVP Chart: CVP chart is the short form of a cost volume profit chart. It shows the relationship between the units produced in a particular period, total cost involved and the sales revenues in that period.
Contribution margin income statement: It is a statement where variable costs are deducted from the sales dollars to get the contribution margin and then all fixed costs are deducted from the contribution margin to get the net
1.
To calculate:
(a) Estimated Break-even point in terms of sales units
(b) Estimated Break-even point in terms of sales dollars
Answer to Problem 3BPSB
Solution:
(a) Estimated Break-even point in terms of sales units is 300.
(b) Estimated Break-even point in terms of sales dollars is $105,000
Explanation of Solution
Explanations:
Given:
Fixed costs= $42,000
Selling price= $350 per unit
Calculation:
Here, the given variable cost is the forecasted one, so the calculated value is for the estimated break-even point in terms of sales unit.
Here, the given variable cost is the forecasted one, so the calculated value is for the estimated break-even point in terms of sales dollars.
2.
To Prepare:
A CVP chart
Answer to Problem 3BPSB
Solution:
Explanation of Solution
Explanations:
Given:
Maximum number of sales = 700
Maximum sales revenue = $245,000
Fixed costs= $42,000
Forecasted variable cost= $210 per unit
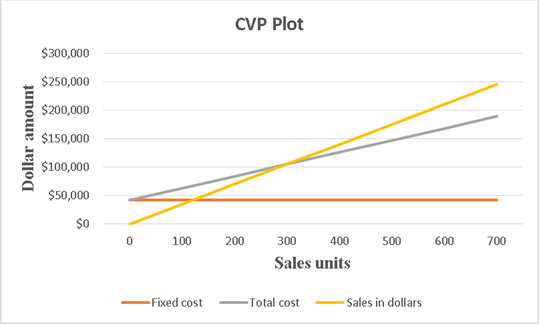
A CVP graph has graph lines for fixed cost, total cost and sales revenue. Here, fixed cost and maximum sales are known. Now total cost at maximum number of sales has to be calculated.
Calculation:
The formula for total cost is given below.
Based on these information, a table showing fixed cost, total cost and sales in dollars at different label of sales can be constructed as shown below.
| Sales units | Fixed cost | Total cost | Sales in dollars |
| 0 | $42,000 | $42,000 | $ - |
| 100 | $42,000 | $63,000 | $ 35,000 |
| 200 | $42,000 | $84,000 | $ 70,000 |
| 300 | $42,000 | $105,000 | $ 105,000 |
| 400 | $42,000 | $126,000 | $ 140,000 |
| 500 | $42,000 | $147,000 | $ 175,000 |
| 600 | $42,000 | $168,000 | $ 210,000 |
| 700 | $42,000 | $189,000 | $ 245,000 |
In the above table, total costs at different units of sales are calculated using the above given formula and sales in dollars are the sales units times the selling price.
By selecting this table in excel sheet, the required CVP chart is prepared as shown below.

3.
To Show:
Contribution margin income statement at break-even point
Answer to Problem 3BPSB
Solution:
| Contribution margin income statement | |
| Sales | $105,000 |
| Less Variable costs | $63,000 |
| Contribution margin | $42,000 |
| Less Fixed cost | $42,000 |
| Net profit | $0 |
Explanation of Solution
Explanations:
Given:
Fixed costs= $42,000
Selling price= $350 per unit
Forecasted variable cost= $210 per unit
Break-even point sales units= 300
Calculation:
Based on these calculations, a contribution margin income statement is prepared as shown below.
| Contribution margin income statement | |
| Sales | $105,000 |
| Less Variable costs | $63,000 |
| Contribution margin | $42,000 |
| Less Fixed cost | $42,000 |
| Net profit | $0 |
At break-even point, net profit must be zero as shown by the above contribution margin income statement.
Want to see more full solutions like this?
Chapter 21 Solutions
FUNDAMENTAL ACCOUNTING-CONNECT ACCESS


 AccountingAccountingISBN:9781337272094Author:WARREN, Carl S., Reeve, James M., Duchac, Jonathan E.Publisher:Cengage Learning,
 Accounting Information SystemsAccountingISBN:9781337619202Author:Hall, James A.Publisher:Cengage Learning,
 Horngren's Cost Accounting: A Managerial Emphasis...AccountingISBN:9780134475585Author:Srikant M. Datar, Madhav V. RajanPublisher:PEARSON
 Intermediate AccountingAccountingISBN:9781259722660Author:J. David Spiceland, Mark W. Nelson, Wayne M ThomasPublisher:McGraw-Hill Education
 Financial and Managerial AccountingAccountingISBN:9781259726705Author:John J Wild, Ken W. Shaw, Barbara Chiappetta Fundamental Accounting PrinciplesPublisher:McGraw-Hill Education