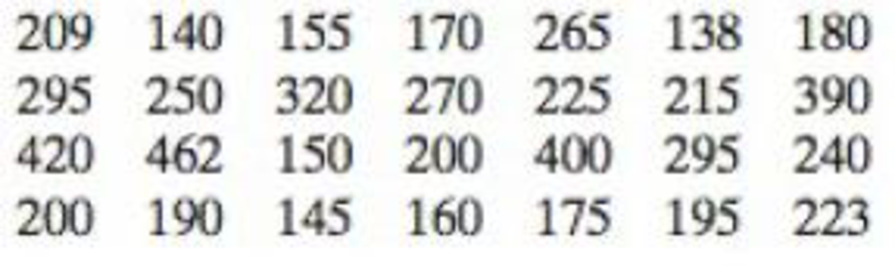
Constructing a Frequency Distribution and a Relative Frequency Histogram In Exercises 37–40, construct a frequency distribution and a relative frequency histogram for the data set using five classes. Which class has the greatest relative frequency and which has the least relative frequency? 40. Triglyceride Levels Data set: Triglyceride levels (in milligrams per deciliter of blood) of 28 patients
Constructing a Frequency Distribution and a Relative Frequency Histogram In Exercises 37–40, construct a frequency distribution and a relative frequency histogram for the data set using five classes. Which class has the greatest relative frequency and which has the least relative frequency? 40. Triglyceride Levels Data set: Triglyceride levels (in milligrams per deciliter of blood) of 28 patients
Constructing a Frequency Distribution and a Relative Frequency HistogramIn Exercises 37–40, construct a frequency distribution and a relative frequency histogram for the data set using five classes. Which class has the greatest relative frequency and which has the least relative frequency?
40. Triglyceride Levels
Data set: Triglyceride levels (in milligrams per deciliter of blood) of 28 patients
Essentials of Statistics, Books a la Carte Edition (5th Edition)
Knowledge Booster
Learn more about
Need a deep-dive on the concept behind this application? Look no further. Learn more about this topic, statistics and related others by exploring similar questions and additional content below.
How to make Frequency Distribution Table / Tally Marks and Frequency Distribution Table; Author: Reenu Math;https://www.youtube.com/watch?v=i_A6RiE8tLE;License: Standard YouTube License, CC-BY


 Big Ideas Math A Bridge To Success Algebra 1: Stu...AlgebraISBN:9781680331141Author:HOUGHTON MIFFLIN HARCOURTPublisher:Houghton Mifflin Harcourt
 Glencoe Algebra 1, Student Edition, 9780079039897...AlgebraISBN:9780079039897Author:CarterPublisher:McGraw Hill
 Holt Mcdougal Larson Pre-algebra: Student Edition...AlgebraISBN:9780547587776Author:HOLT MCDOUGALPublisher:HOLT MCDOUGAL