
Videos
a.
Construct the percent frequency distribution of field of study for each degree.
a.
Answer to Problem 9E
The percent frequency distribution for bachelor’s degree is given below:
| Bachelor’s degree | Relative frequency | Percent frequency |
| B | 0.21 | 21% |
| CSE | 0.09 | 9% |
| E | 0.06 | 6% |
| H | 0.16 | 16% |
| NSM | 0.08 | 8% |
| O | 0.24 | 24% |
| SBS | 0.16 | 16% |
| Total | 1.00 | 100 |
The percent frequency distribution for Master’s degree is given below:
| Master’s degree | Relative Frequency | Percent frequency |
| B | 0.27 | 27% |
| CSE | 0.09 | 9% |
| E | 0.24 | 24% |
| H | 0.08 | 8% |
| NSM | 0.02 | 2% |
| O | 0.24 | 24% |
| SBS | 0.06 | 6% |
| Total | 1.00 | 100 |
Explanation of Solution
Calculation:
The Country U provided 1.8 million bachelor’s degree and 750,000 master’s degree and a sample of 100 graduates is considered. The field of studies of graduates are, Business (B), Computer science and Engineering (CSE), Education (E), Natural sciences and Mathematics (NSM), Social and Behavioral sciences (SBS), and other (O).
For Bachelor’s degree:
Frequency:
The frequencies are calculated using the tally mark. Here, the number of times each class repeats is the frequency of that particular class.
Here, “B (business)” is the department type data that is repeated 21 times in the data set and thus, 21 is the frequency for the category business (B).
Similarly, the frequency of remaining types of network is given below:
| Bachelor’s degree | Tally | Frequency |
| B | 21 | |
| CSE | 9 | |
| E | 6 | |
| H | 16 | |
| NSM | 8 | |
| O | 24 | |
| SBS | 16 | |
| Total | 100 |
Relative frequency:
The general formula for the relative frequency is as follows:
Therefore,
Similarly, the relative frequencies for the remaining types of classes (PPG) are obtained below:
| Bachelor’s degree | Frequency | Relative frequency |
| B | 0.21 | 0.21 |
| CSE | 0.09 | 0.09 |
| E | 0.06 | 0.06 |
| H | 0.16 | 0.16 |
| NSM | 0.08 | 0.08 |
| O | 0.24 | 0.24 |
| SBS | 0.16 | 0.16 |
| Total | 1.00 | 1.00 |
Percentage frequency distribution:
The general formula for the percent frequency is as follows:
Therefore,
The percent frequencies for the remaining types of categories of education fields for bachelor degree are obtained below:
| Bachelor’s degree | Relative frequency | Percent frequency |
| B | 0.21 | 21% |
| CSE | 0.09 | 9% |
| E | 0.06 | 6% |
| H | 0.16 | 16% |
| NSM | 0.08 | 8% |
| O | 0.24 | 24% |
| SBS | 0.16 | 16% |
| Total | 1.00 | 100 |
For Master’s degree:
Here, “B (business)” is the department type data that is repeated for 27 times in the data set and thus, 27 is the frequency for the category business (B).
Similarly, the frequency of remaining types of department fields is given below:
| Master’s degree | Tally | Frequency |
| B | 27 | |
| CSE | 9 | |
| E | 24 | |
| H | 8 | |
| NSM | 2 | |
| O | 24 | |
| SBS | 6 | |
| Total | 100 |
Relative frequency:
Similarly, the relative frequencies for the remaining types of classes (PPG) are obtained below:
| Master’s degree | Frequency | Relative frequency |
| B | 27 | 0.27 |
| CSE | 9 | 0.09 |
| E | 24 | 0.24 |
| H | 8 | 0.08 |
| NSM | 2 | 0.02 |
| O | 24 | 0.24 |
| SBS | 6 | 0.06 |
| Total | 100 | 1.00 |
Percentage frequency distribution:
The percent frequencies for the remaining types of categories of education fields for master degree are obtained below:
| Master’s degree | Relative Frequency | Percent frequency |
| B | 0.27 | 27% |
| CSE | 0.09 | 9% |
| E | 0.24 | 24% |
| H | 0.08 | 8% |
| NSM | 0.02 | 2% |
| O | 0.24 | 24% |
| SBS | 0.06 | 6% |
| Total | 1.00 | 100 |
b.
Construct the bar chart for each degree.
b.
Answer to Problem 9E
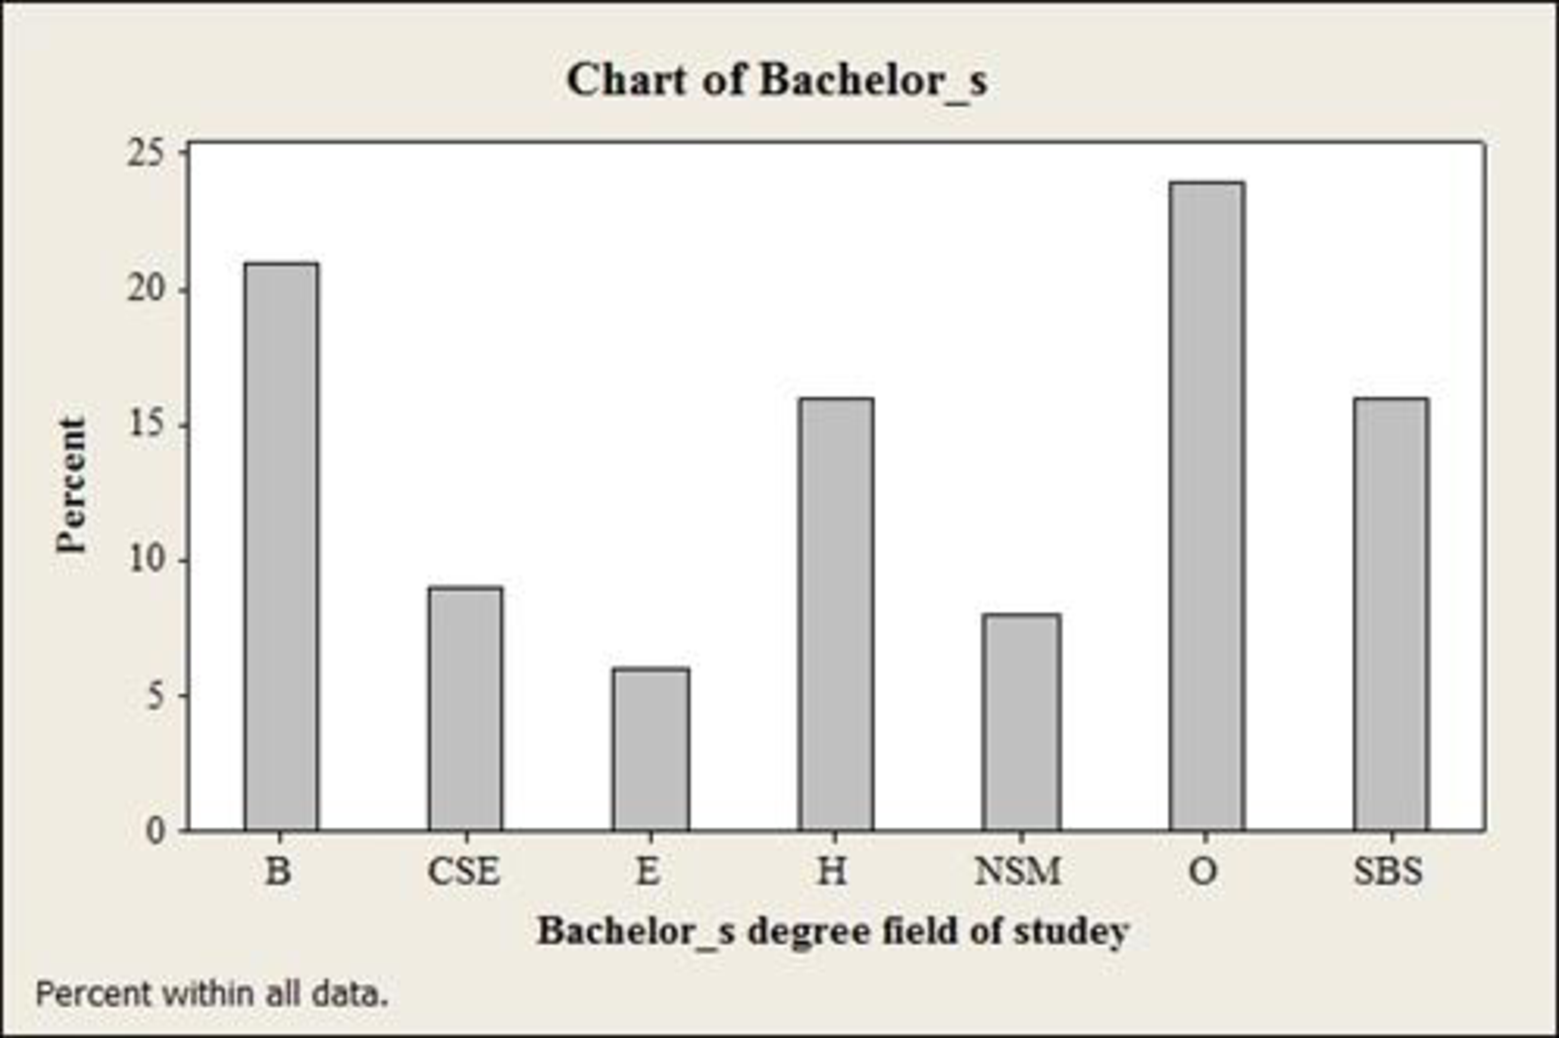
The bar chart for bachelor’s degree is given below:
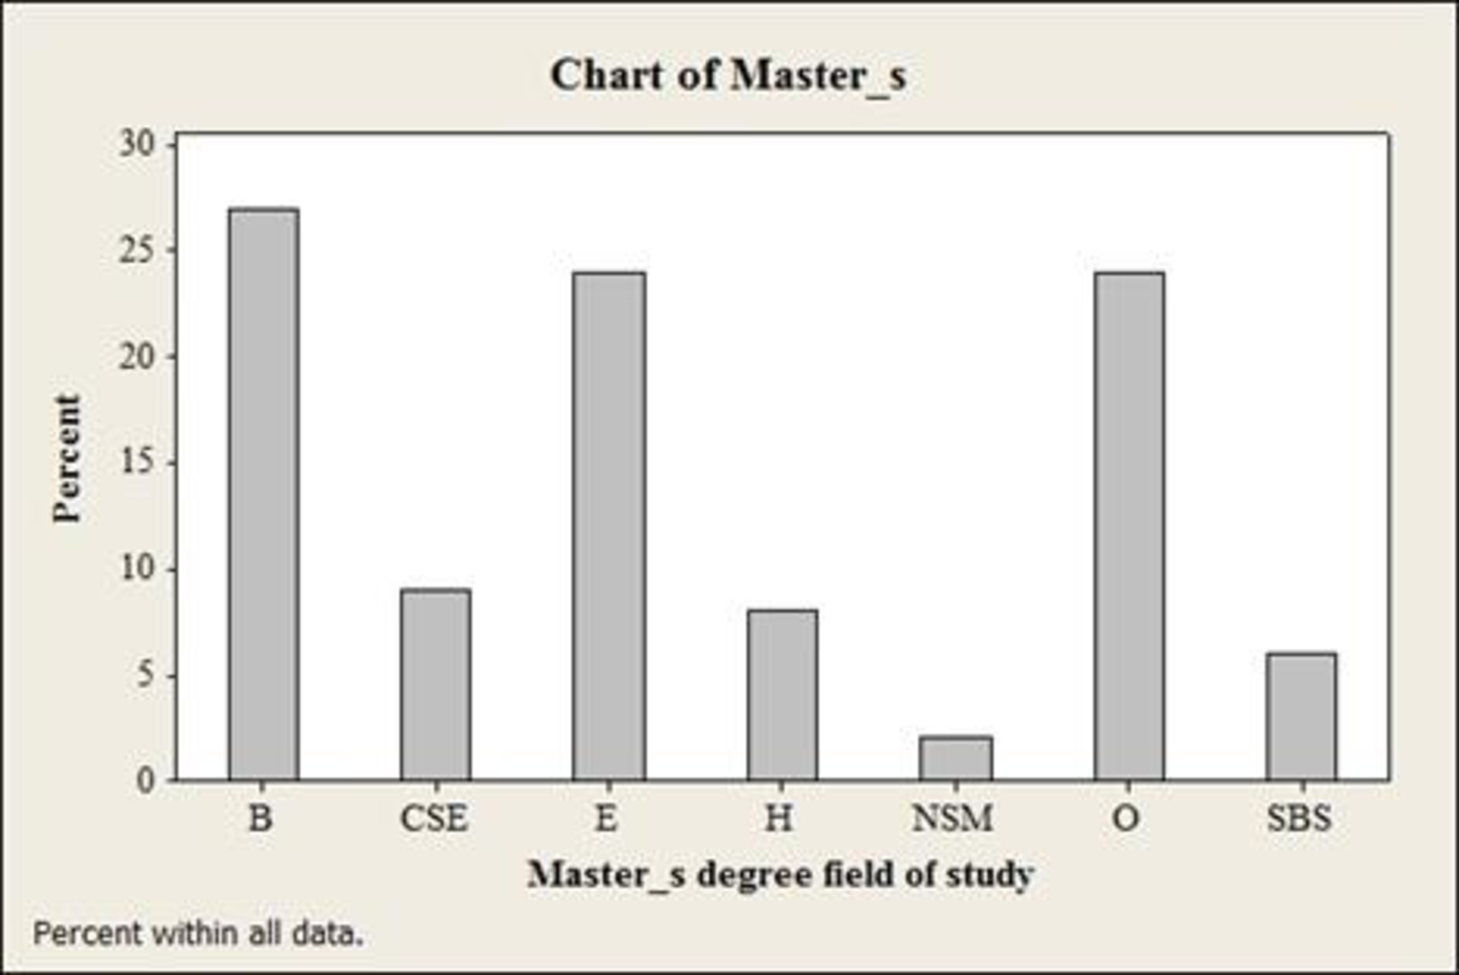
The bar chart for Master’s degree is given below:
Explanation of Solution
Calculation:
For Bachelor’s degree:
Software procedure:
Step-by-step procedure to draw the bar chart for bachelor’s degree using MINITAB software:
- Choose Graph > Bar Chart.
- From Bars represent, choose unique values from table.
- Choose Simple. Click OK.
- In Graph variables, enter the column of Bachelor’s degree.
- Click OK.
- For Master’s degree:
Software procedure:
Step-by-step procedure to draw the bar chart for Master’s degree using MINITAB software:
- Choose Graph > Bar Chart.
- From Bars represent, choose unique values from table.
- Choose Simple. Click OK.
- In Graph variables, enter the column of Master’s degree.
- Click OK.
c.
Find the lowest percentage field of study for each degree.
c.
Answer to Problem 9E
The lowest percentage for a Bachelor’ degree is Education.
The lowest percentage for a Master’s degree is Natural science and Mathematics.
Explanation of Solution
For Bachelor’ degree, the percentage for education is 6%, which is low when compared to other categories.
For Master’s degree, the percentage for Natural science and Mathematics is 2%, which is low when compared to other categories.
d.
Find the highest percentage field of study for each degree.
d.
Answer to Problem 9E
The highest percentage for a Bachelor’ degree is Others.
The highest percentage for a Master’s degree is Business.
Explanation of Solution
For Bachelor’ degree, the percentage for others is 24%, which is high when compared to other categories.
For Master’s degree, the percentage for business is 27%, which is high when compared to other categories.
e.
Identify which field of study “Education” has the largest increase in percentage from bachelor’s to masters’.
e.
Answer to Problem 9E
The field of study “Education” has the largest increase in percentage from bachelor’s to masters’.
Explanation of Solution
Calculation:
In order to the obtain the study field that has the largest increase in percentage from bachelor’s to
Master, the difference between two respective percentages is calculated.
Therefore,
The differences between two fields are tabulated below:
| Field | Bachelor’s | Master’s | Difference |
| B | 21% | 21% | 6% |
| CSE | 9% | 9% | 0% |
| E | 6% | 6% | 18% |
| H | 16% | 16% | |
| NSM | 8% | 8% | |
| O | 24% | 24% | |
| SBS | 16% | 16% |
From the table, it is observed that the field of study “Education” has the largest increase in percentage from bachelor’s to masters’.
Want to see more full solutions like this?
Chapter 2 Solutions
Bundle: Essentials of Statistics for Business and Economics, Loose-leaf Version, 8th + MindTap Business Statistics, 1 term (6 months) Printed Access Card


 Glencoe Algebra 1, Student Edition, 9780079039897...AlgebraISBN:9780079039897Author:CarterPublisher:McGraw Hill
 Holt Mcdougal Larson Pre-algebra: Student Edition...AlgebraISBN:9780547587776Author:HOLT MCDOUGALPublisher:HOLT MCDOUGAL