Concept explainers
Videos
a.
Construct the percent frequency distribution for each degree.
a.
Answer to Problem 9E
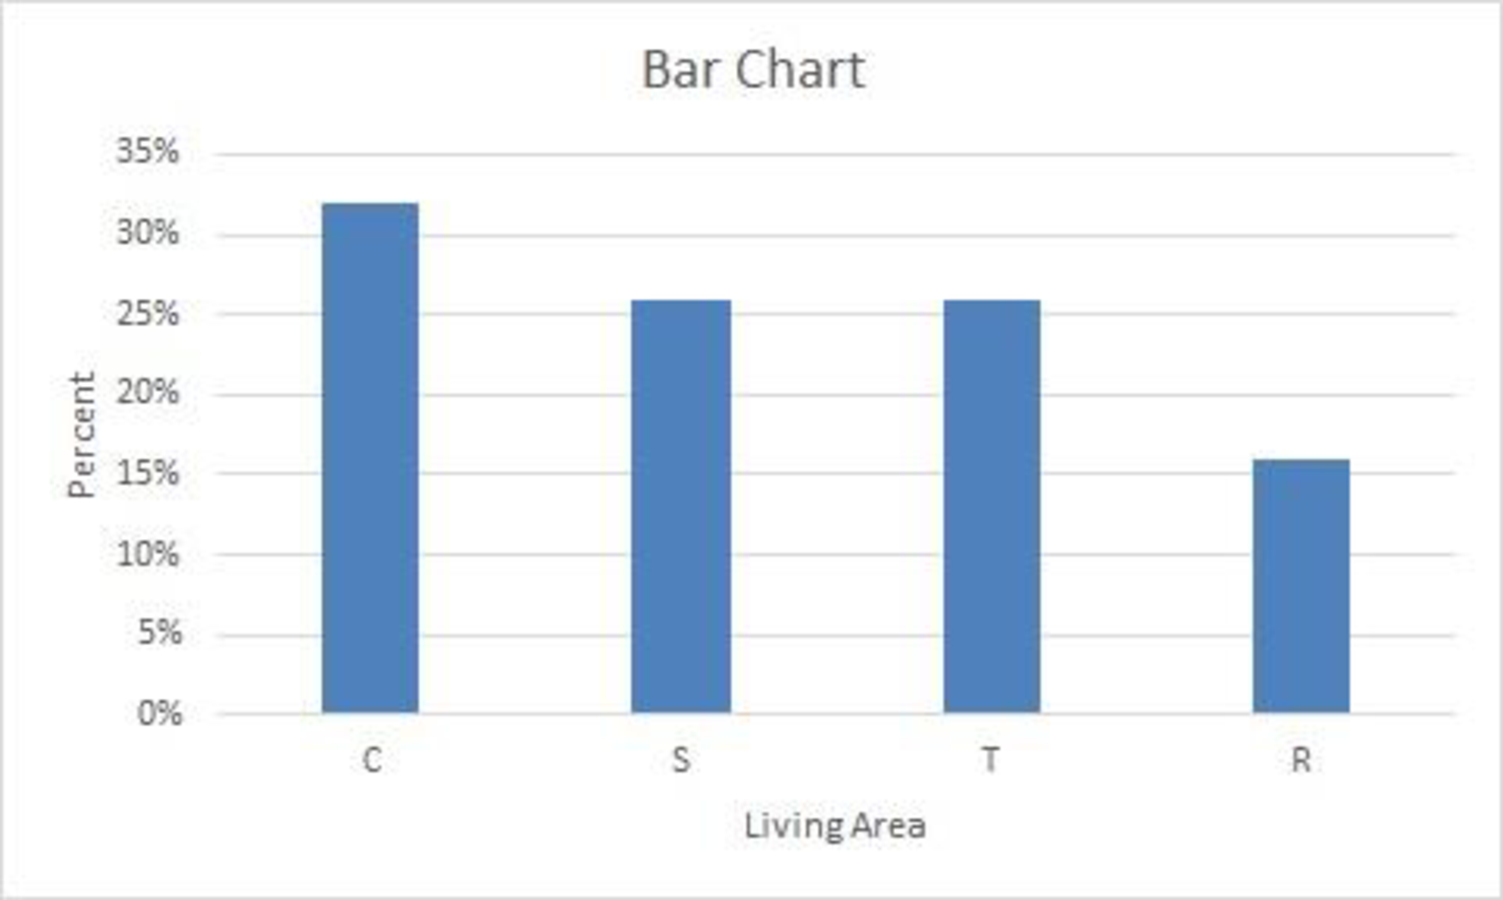
The percent frequency distributions for where the adults live now are given below:
| Responses | Percent frequency |
| C | 32% |
| S | 26% |
| T | 26% |
| R | 16% |
| Total | 100% |
The percent frequency distributions for ideal community are given below:
| Responses | Percent frequency |
| C | 24% |
| S | 25% |
| T | 30% |
| R | 21% |
| Total | 100% |
Explanation of Solution
Calculation:
The data represent 46% of adults from Country U who would live in a different type of community than the one where they are living now. A sample of 2,260 adults is surveyed. The response options are City(C), Suburb(S), Small Town(T), or Rural(R).
For living now:
Frequency:
The frequencies are calculated using the tally marks. Here, the number of times each class repeats is the frequency of that particular class.
Here, “C (city)” is the response data, which is repeated 32 times in the data set and thus, 32 is the frequency for the response “C (city)”.
Similarly, the frequencies of the remaining responses are as follows:
| Responses | Tally | Frequency |
| C | 32 | |
| S | 26 | |
| T | 26 | |
| R | 16 | |
| Total | 100 |
Relative frequency:
The general formula for relative frequency is given below:
Therefore, the following value is obtained:
Similarly, the relative frequencies for the remaining responses of a class are obtained below:
| Responses | Frequency | Relative frequency |
| C | 32 | 0.32 |
| S | 26 | |
| T | 26 | |
| R | 16 | |
| Total | 100 | 1.00 |
Percentage frequency distribution:
The general formula for percent frequency is given below:
Therefore, the following value is obtained:
The percent frequencies for the remaining responses for living now are obtained below:
| Responses | Relative frequency | Percent frequency |
| C | 0.32 | 32% |
| S | 0.26 | |
| T | 0.26 | |
| R | 0.16 | |
| Total | 1.00 | 100 |
For ideal community:
Here, “C (city)” is the response data, which is repeated 24 times in the data set and thus, 24 is the frequency for the response “C (city)”.
Similarly, the frequencies of the remaining types of department fields are given below:
| Responses | Tally | Frequency |
| C | 24 | |
| S | 25 | |
| T | 30 | |
| R | 21 | |
| Total | 100 |
Relative frequency:
Similarly, the relative frequencies for the remaining responses are obtained as follows:
| Responses | Frequency | Relative frequency |
| C | 24 | 0.24 |
| S | 25 | |
| T | 30 | |
| R | 21 | |
| Total | 100 | 1.00 |
Percentage frequency distribution:
The percent frequencies for the remaining responses for ideal community are obtained as follows:
| Responses | Relative frequency | Percent frequency |
| C | 0.24 | 24% |
| S | 0.25 | |
| T | 0.30 | |
| R | 0.21 | |
| Total | 1.00 | 100 |
b.
Construct the bar chart for each question.
b.
Answer to Problem 9E
Output obtained from Excel for the response of the first question is given below:
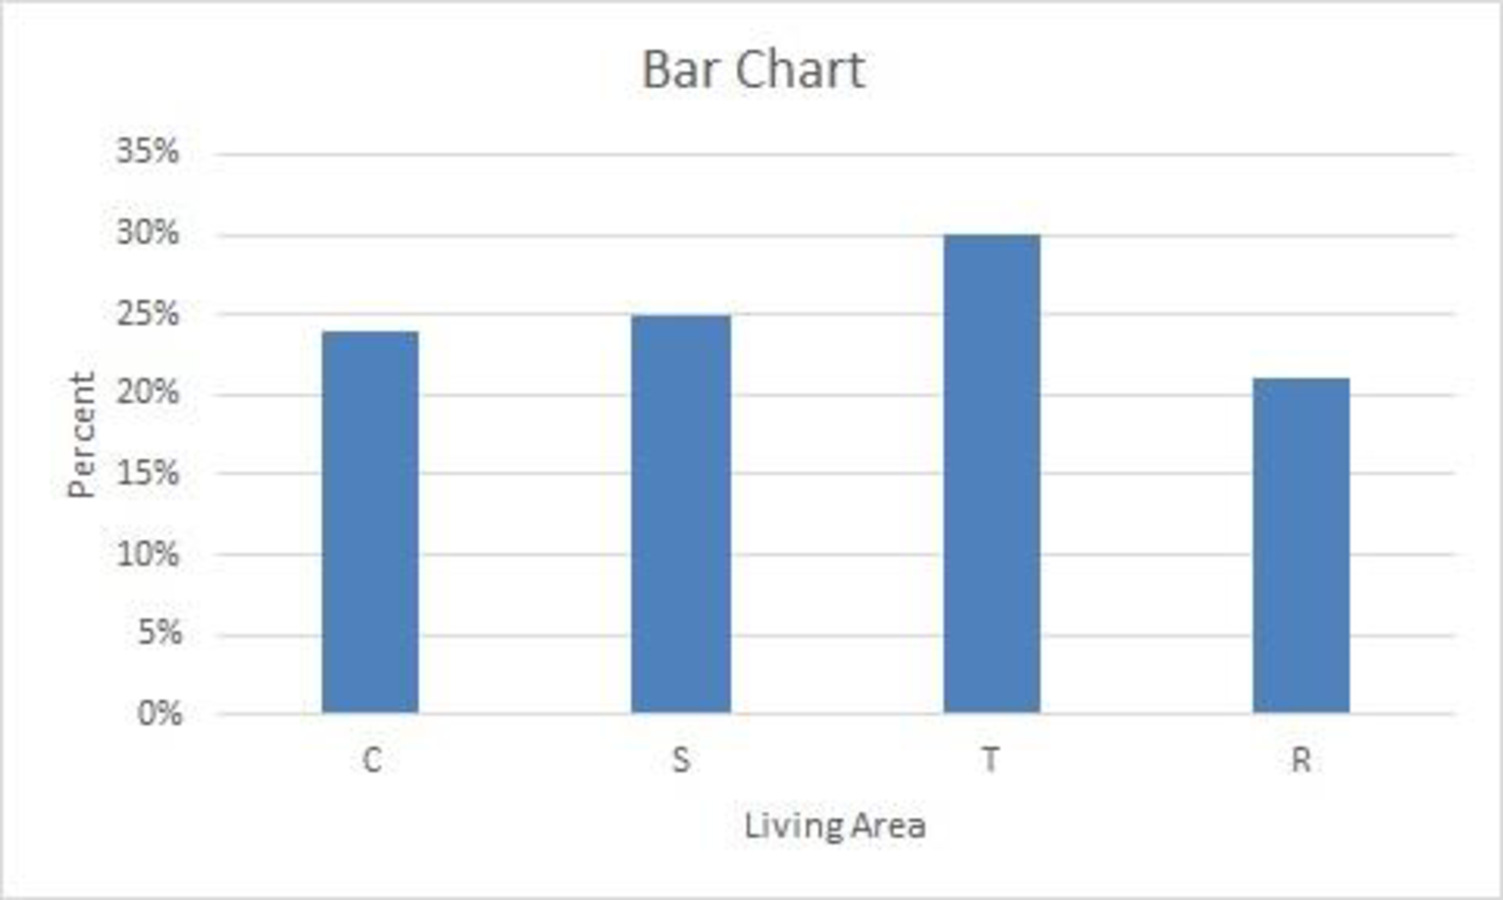
Output obtained from Excel for the response of the second question is given below:
Explanation of Solution
Calculation:
For living now:
Software procedure:
Step-by-step procedure to draw the bar chart for the first question using Excel:
- In Excel sheet, enter Living now in one column and Frequency in another column.
- Select the data and then choose Insert > Insert Column Bar Charts.
- Select Clustered Column Under More Column Charts.
- For ideal community:
Software procedure:
Step-by-step procedure to draw the bar chart for ideal community using Excel:
- In Excel sheet, enter Ideal community in one column and Frequency in another column.
- Select the data and then choose Insert > Insert Column Bar Charts.
- Select Clustered Column Under More Column Charts.
c.
Find the community in which most of the adults are living now.
c.
Answer to Problem 9E
Most of the adults are now living in a city.
Explanation of Solution
For living now, the percentage for city is 32%, which is high when compared to the other communities.
Thus, most of the adults are now living in a city.
d.
Identify the community that most of the adults consider as the ideal community.
d.
Answer to Problem 9E
Most of the adults consider the ideal community as a small town.
Explanation of Solution
For ideal community, the percentage for small town is 30%, which is high when compared to the other communities.
Thus, most of the adults consider the ideal community as a small town.
e.
Identify the changes in living areas that one would expect to see if people moved from where they currently live to their ideal community.
e.
Explanation of Solution
Calculation:
In order to obtain the changes in living areas when people moved from where they currently live to their ideal community, one would expect to find the difference between the two.
Therefore, the value is obtained as follows:
The differences between the living now and the ideal community are tabulated as follows:
| Responses | Living now | Ideal community | Difference |
| C | 32% | 24% | –8% |
| S | 26% | 25% | –1% |
| T | 26% | 30% | +4% |
| R | 16% | 21% | +5% |
From the table, it is observed that the living area “city” has the largest decrease in percentage from living now to ideal community. For suburb, living is steady. For small towns and rural areas, the percentage of living increases.
Want to see more full solutions like this?
Chapter 2 Solutions
Bundle: Modern Business Statistics With Microsoft Excel, 5th + Cengagenow, 2 Term (12 Months) Printed Access Card


 Big Ideas Math A Bridge To Success Algebra 1: Stu...AlgebraISBN:9781680331141Author:HOUGHTON MIFFLIN HARCOURTPublisher:Houghton Mifflin Harcourt
 Holt Mcdougal Larson Pre-algebra: Student Edition...AlgebraISBN:9780547587776Author:HOLT MCDOUGALPublisher:HOLT MCDOUGAL