
Concept explainers
Videos
The Pew Research Center’s Social & Demographic Trends project found that 46% of U.S. adults would rather live in a different type of community than the one where they are living now (Pew Research Center, January 29, 2009). The national survey of 2260 adults asked: “Where do you live now?” and “What do you consider to be the ideal community?” Response options were City (C), Suburb (S), Small Town (T), or Rural (R). A representative portion of this survey for a sample of 100 respondents is as follows.
Where do you live now?
| S | T | R | C | R | R | T | C | S | T | C | S | C | S | T |
| S | S | C | S | S | T | T | C | C | S | T | C | S | T | C |
| T | R | S | S | T | C | S | C | T | C | T | C | T | C | R |
| C | C | R | T | C | S | S | T | S | C | C | C | R | S | C |
| S | S | C | C | S | C | R | T | T | T | C | R | T | C | R |
| C | T | R | R | C | T | C | C | R | T | T | R | S | R | T |
| T | S | S | S | S | S | C | C | R | T |
What do you consider to be the ideal community?
| S | C | R | R | R | S | T | S | S | T | T | S | C | S | T |
| C | C | R | T | R | S | T | T | S | S | C | C | T | T | S |
| S | R | C | S | C | C | S | C | R | C | T | S | R | R | R |
| C | T | S | T | T | T | R | R | S | C | C | R | R | S | S |
| S | T | C | T | T | C | R | T | T | T | C | T | T | R | R |
| C | S | R | T | C | T | C | C | T | T | T | R | C | R | T |
| T | C | S | S | C | S | T | S | S | R |
- a. Provide a percent frequency distribution for each question.
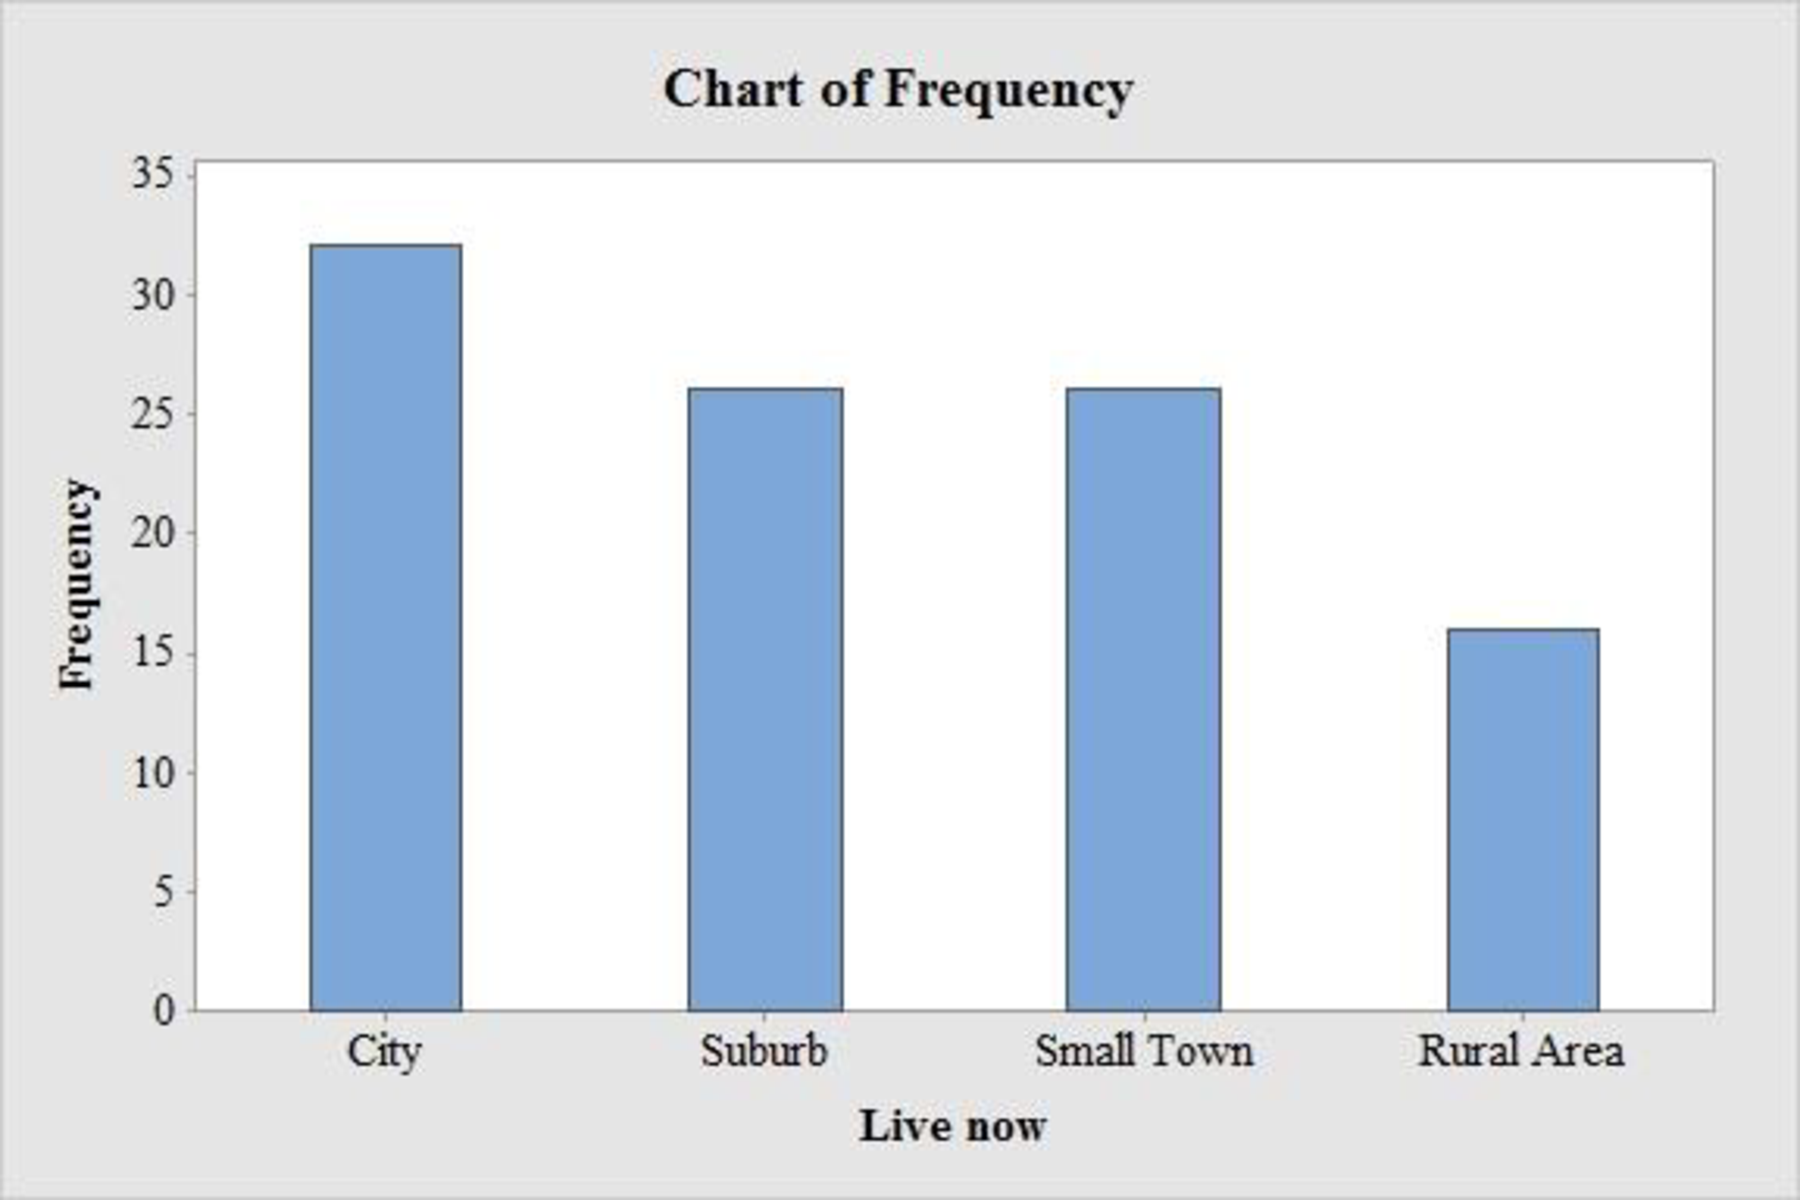
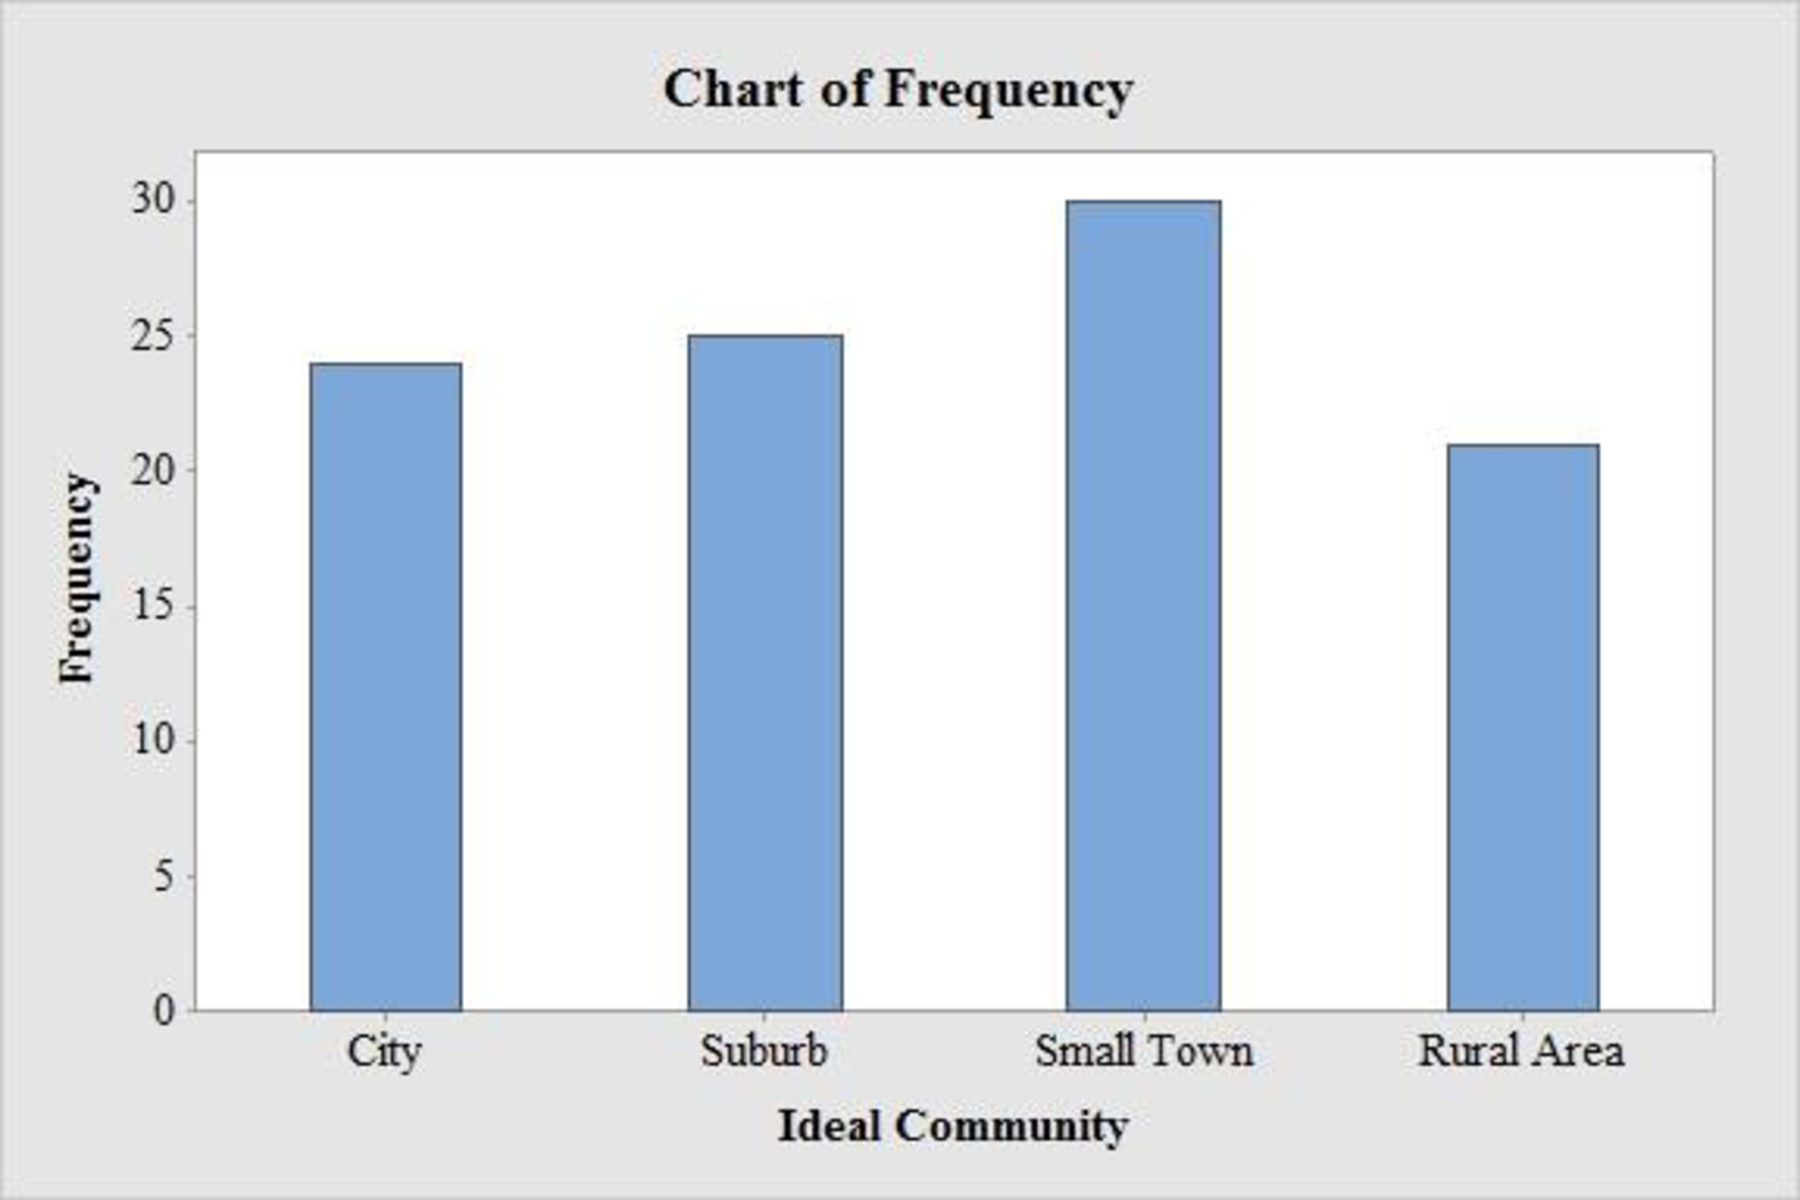
- b. Construct a bar chart for each question.
- c. Where are most adults living now?
- d. Where do most adults consider the ideal community?
- e. What changes in living areas would you expect to see if people moved from where they currently live to their ideal community?
a.
Construct the percent frequency distribution for each question.
Answer to Problem 9E
The percent frequency distribution for live now:
| Live now | Percent frequency |
| City | 32% |
| Suburb | 26% |
| Small Town | 26% |
| Rural Area | 16% |
| Total | 100 |
The percent frequency distribution for Ideal Community:
| Ideal Community | Percent frequency |
| City | 24% |
| Suburb | 25% |
| Small Town | 30% |
| Rural Area | 21% |
| Total | 100 |
Explanation of Solution
The given information is that Pew Research Centers Social & Demographic Trends project show that 46% of U.S adults would rather live in a different type of community than where they are living now. In the national survey of 2,260 adults are asked two types of questions. A sample of 100 respondents is provided. The respective living areas are City, Suburb, Small Town and Rural Area.
Calculation:
For live now:
Frequency:
The frequencies are calculated by using the tally mark.
Here, the number of times each class repeats is the frequency of that particular class.
Here, “City” is repeated for 32 times in the data set and thus 32 is the frequency for the category City.
Similarly, the frequency of remaining types of living area is given below:
| Live Now | Tally | Frequency |
| City | 32 | |
| Suburb | 26 | |
| Small Town | 26 | |
| Rural Area | 16 | |
| Total | 100 |
Relative frequency:
The general formula for the relative frequency is,
Therefore,
Similarly, the relative frequencies for the remaining types of living area are obtained below:
| Live Now | Frequency | Relative frequency |
| City | 32 | 0.32 |
| Suburb | 26 | 0.26 |
| Small Town | 26 | 0.26 |
| Rural Area | 16 | 0.16 |
| Total | 100 | 1.00 |
Percentage frequency distribution:
The general formula for the percent frequency is,
Therefore,
The percent frequencies for the remaining types of categories of living area for live now are obtained below:
| Live Now | Relative frequency | Percent frequency |
| City | 0.32 | 32% |
| Suburb | 0.26 | 26% |
| Small Town | 0.26 | 26% |
| Rural Area | 0.16 | 16% |
| Total | 1.00 | 100 |
For ideal community:
Here, city is repeated for 24 times in the data set and thus 24 is the frequency for the living area city.
Similarly, the frequency of remaining types of living area is given below:
| Ideal community | Tally | Frequency |
| City | 24 | |
| Suburb | 25 | |
| Small Town | 30 | |
| Rural Area | 21 | |
| Total | 100 |
Relative frequency:
Similarly, the relative frequencies for the remaining types of living area are obtained below:
| Ideal community | Frequency | Relative frequency |
| City | 24 | 0.24 |
| Suburb | 25 | 0.25 |
| Small Town | 30 | 0.30 |
| Rural Area | 21 | 0.21 |
| Total | 100 | 1.00 |
Percentage frequency distribution:
The percent frequencies for the remaining types of categories of living area of ideal community are obtained below:
| Ideal community | Relative Frequency | Percent frequency |
| City | 0.24 | 24% |
| Suburb | 0.25 | 25% |
| Small Town | 0.30 | 30% |
| Rural Area | 0.21 | 21% |
| Total | 1.00 | 100 |
b.
Construct the bar chart for each question.
Explanation of Solution
Output obtained from MINITAB software for live now is:
Output obtained from MINITAB software for Ideal community is:
Calculation:
For live now:
Software procedure:
Step by step procedure to draw the bar chart for bachelor’s degree using MINITAB software.
- Choose Graph > Bar Chart.
- From Bars represent, choose unique values from table.
- Choose Simple. Click OK.
- In Graph variables, enter the column of Live now.
- Click OK
- For ideal community:
Step by step procedure to draw the bar chart for Master’s degree using MINITAB software.
- Choose Graph > Bar Chart.
- From Bars represent, choose unique values from table.
- Choose Simple. Click OK.
- In Graph variables, enter the column of Ideal Community.
- Click OK
c.
Find the living area where the most adults are living now.
Answer to Problem 9E
The most adults in living now consider a City.
Explanation of Solution
For living now, the percentage for city is 32%, which is high when compared to other categories.
d.
Find the living area which the most adults are considered as an ideal community.
Answer to Problem 9E
The most adults consider the ideal community is a small town.
Explanation of Solution
For ideal, the percentage for small town is 30%, which is high when compared to other categories.
e.
Identify the changes in living areas would expect to see if people moved from where they currently live to their ideal community.
Explanation of Solution
The percentage changes can be obtained as follows:
Therefore,
The differences between two living areas are tabulated below:
| Living Area | Living now | Ideal community | Difference |
| City | 32% | 24% | –8% |
| Suburb | 26% | 25% | –1% |
| Small Town | 26% | 30% | 4% |
| Rural Area | 16% | 21% | 5% |
From the table, it is observed that the living areas “small town and rural area” has increased in percentage from “living now” to “ideal community” and the living areas “city and suburb” has decrease in percentage from “living now” to “ideal community”.
Want to see more full solutions like this?
Chapter 2 Solutions
Statistics for Business & Economics, Revised (MindTap Course List)


 Big Ideas Math A Bridge To Success Algebra 1: Stu...AlgebraISBN:9781680331141Author:HOUGHTON MIFFLIN HARCOURTPublisher:Houghton Mifflin Harcourt
 Holt Mcdougal Larson Pre-algebra: Student Edition...AlgebraISBN:9780547587776Author:HOLT MCDOUGALPublisher:HOLT MCDOUGAL