
Concept explainers
Videos
(a)
The amount of widget sales in the year
(b)
The year when widget sales reach
(c)
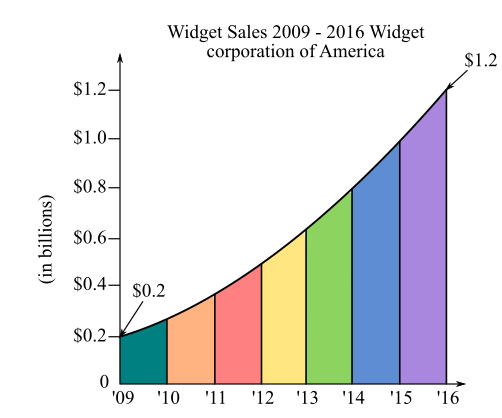
The representation of line graph given below,
(d)
The variables that are represented on the x-axis and y-axis of the line chart “widget sales
(e)
The amount of widget sales in the year
(f)
The year when widget sales reached
(g)
To calculate: The comparison between the widget sales of

Trending nowThis is a popular solution!

Chapter 21 Solutions
Contemporary Mathematics for Business & Consumers


 Holt Mcdougal Larson Pre-algebra: Student Edition...AlgebraISBN:9780547587776Author:HOLT MCDOUGALPublisher:HOLT MCDOUGAL
 Glencoe Algebra 1, Student Edition, 9780079039897...AlgebraISBN:9780079039897Author:CarterPublisher:McGraw Hill
 Big Ideas Math A Bridge To Success Algebra 1: Stu...AlgebraISBN:9781680331141Author:HOUGHTON MIFFLIN HARCOURTPublisher:Houghton Mifflin Harcourt
 Algebra: Structure And Method, Book 1AlgebraISBN:9780395977224Author:Richard G. Brown, Mary P. Dolciani, Robert H. Sorgenfrey, William L. ColePublisher:McDougal Littell