
Videos
Modeling Data
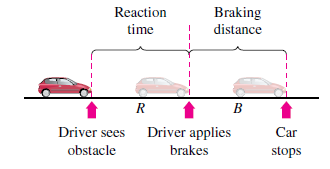
The stopping distance of an automobile, on dry, level pavement, traveling at a speed v (in kilometers per hour)is the distance R (in meters) the car travels during the reaction time of the driver plus die distance B (in meters)the car travels after the brakes are applied (see figure).The table shows the results of an experiment.
| Speed, v | 20 | 40 | 60 | 80 | 100 |
| Reaction Time Distance, R | 8.3 | 16.7 | 25.0 | 33.3 | 41.7 |
| Braking Time Distance, B | 2.3 | 9.0 | 20.2 | 35.8 | 55.9 |

(a) Use the regression capabilities of a graphing utility to find a linear model for reaction time distance R.
(b) Use the regression capabilities of a graphing utility to find a quadratic model for braking time distance B.
(c) Determine the polynomial giving the total stopping distance T.
(d) Use a graphing utility to graph the functions R, B, and T in the same viewing window.
(e) Find the derivative of T and the rates of change of the total stopping distance for v = 40, v = 80, and v = 100.
(f) Use the results of this exercise to draw conclusions about the total stopping distance as speed increases.
Want to see the full answer?
Check out a sample textbook solution
Chapter 2 Solutions
Calculus of a Single Variable


- What is interpolation when using a linear model?arrow_forwardFill in the blanks. Statisticians use a measure called the ________ of the ________ ________ to find a model that approximates a set of data most accurately.arrow_forwardExam Scores The table shows the mathematics entrance test scores x and the final examination scores y in an algebra course for a sample of 10 students. (a) Sketch a scatter plot of the data. (b) Find the entrance test score of any student with a final exam score in the 80s. (c) Does a higher entrance test score imply a higher final exam score? Explain.arrow_forward
- Mobile Phone Sales In 2000, mobile handset sales totaled 414.99million. In 2005, the total was 778.75million. Let M=M(t) denote total mobile handset sales in year t. What was the average rate of change per year in M(t) from 2000 to 2005? Be sure to include proper units with your answer.arrow_forwardDVD Player sales The table shows the number of DVD play-ers sold in a small electronics store in the years 2003-2013. What was the average rate of change of sales between 2003 and 2013? Whatwas the average rate of change of sales between 2003 and 2004? What was the average rate of change of sales between 2004 and 2005? Between which two successive years did DVD player sales increase most quickly?arrow_forward

 Trigonometry (MindTap Course List)TrigonometryISBN:9781337278461Author:Ron LarsonPublisher:Cengage Learning
 Algebra and Trigonometry (MindTap Course List)AlgebraISBN:9781305071742Author:James Stewart, Lothar Redlin, Saleem WatsonPublisher:Cengage Learning
 Glencoe Algebra 1, Student Edition, 9780079039897...AlgebraISBN:9780079039897Author:CarterPublisher:McGraw Hill
 College AlgebraAlgebraISBN:9781305115545Author:James Stewart, Lothar Redlin, Saleem WatsonPublisher:Cengage Learning
 Holt Mcdougal Larson Pre-algebra: Student Edition...AlgebraISBN:9780547587776Author:HOLT MCDOUGALPublisher:HOLT MCDOUGAL