Concept explainers
Videos
Video Games and Grade-Point Average Professor Grant Alexander wanted to find a linear model that relates the number of hours a student plays video games each week. , to the cumulative grade-point average. , of the student. He obtained a random sample of 10 full-time students at his college and asked each student to disclose the number of hours spent playing video games and the student’s cumulative grade-point average.
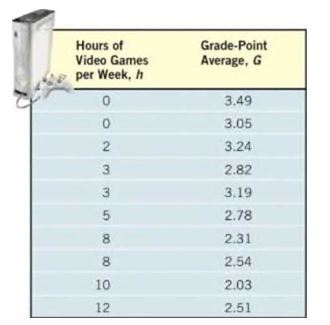
(a) Explain why the number of hours spent playing video games is the independent variable and cumulative grade-point average is the dependent variable.
(b) Use a graphing utility to draw a
(c) Use a graphing utility to find the line of best fit that models the relation between number of hours of video game playing each week and grade-point average. Express the model using function notation.
(d) Interpret the slope.
(e) Predict the grade-point average of a student who plays video games for 8 hours each week.
(f) How many hours of video game playing do you think a student plays whose grade-point average is ?
Want to see the full answer?
Check out a sample textbook solution
Chapter 2 Solutions
Precalculus: Concepts Through Functions, A Unit Circle Approach to Trigonometry (4th Edition)


- Demand for Candy Bars In this problem you will determine a linear demand equation that describes the demand for candy bars in your class. Survey your classmates to determine what price they would be willing to pay for a candy bar. Your survey form might look like the sample to the left. a Make a table of the number of respondents who answered yes at each price level. b Make a scatter plot of your data. c Find and graph the regression line y=mp+b, which gives the number of respondents y who would buy a candy bar if the price were p cents. This is the demand equation. Why is the slope m negative? d What is the p-intercept of the demand equation? What does this intercept tell you about pricing candy bars? Would you buy a candy bar from the vending machine in the hallway if the price is as indicated. Price Yes or No 50 75 1.00 1.25 1.50 1.75 2.00arrow_forwardHOW DO YOU SEE IT? Discuss how well a linear model approximates the data shown in each scatter plot.arrow_forwardCost of Adding Employees The following table shows the cost, in millions of dollars, to Walmart of adding the given number of employees to each of its superstores.14 E = number of new employees 1 2 3 4 C = cost 89.6 179.2 268.8 358.4 a. Find a linear model for the data in the table. b. Explain in practical terms the meaning of the slope of the linear model you found in part a.arrow_forward
- Employee Turnover The percentage of employees who cease their employment during a year is referred to as employee turnover, and it is a serious issue for businesses. The following table shows the cost, in millions of dollars, to Walmart for a given employee turnover percentage in a year.13 E = employee turnover 10 20 30 40 C = cost 250 400 550 700 a. Show that the data can be modeled by a linear function. b. Find the slope of the linear function. c. Find a linear model for the data. d. Use the result from part c to find the cost to Walmart if employee turnover is 33 in a year.arrow_forwardThe ordered pairs below give the median sales prices y (in thousands of dollars) of new homes sold in a neighborhood from 2009 through 2016. (2009, 179.4) (2011, 191.0) (2013, 202.6) (2015, 214.9) (2010, 185.4) (2012, 196.7) (2014, 208.7) (2016, 221.4) A linear model that approximates the data is y=5.96t+125.5,9t16, where t represents the year, with t=9 corresponding to 2009. Plot the actual data and the model on the same graph. How closely does the model represent the data?arrow_forwardSales Barnes & Noble had annual sales of $6.8 billion in 2013 and $6.1 billion in 2015. Use the Midpoint Formula to estimate the sales in 2014. Assume that the annual sales followed a linear pattern.arrow_forward
 Algebra and Trigonometry (MindTap Course List)AlgebraISBN:9781305071742Author:James Stewart, Lothar Redlin, Saleem WatsonPublisher:Cengage Learning
 Functions and Change: A Modeling Approach to Coll...AlgebraISBN:9781337111348Author:Bruce Crauder, Benny Evans, Alan NoellPublisher:Cengage Learning
 Algebra & Trigonometry with Analytic GeometryAlgebraISBN:9781133382119Author:SwokowskiPublisher:Cengage