
EBK CENGAGENOW FOR WEIERS' INTRODUCTION
7th Edition
ISBN: 9780840057655
Author: WEIERS
Publisher: VST
expand_more
expand_more
format_list_bulleted
Videos
Textbook Question
Chapter 2.2, Problem 2.12E
According to the U.S. Department of Agriculture, the distribution of U.S. farms according to value of annual sales is as follows.
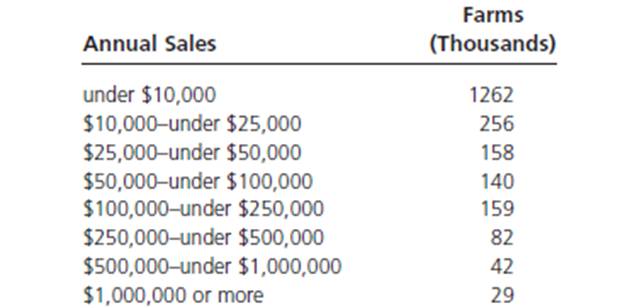
Convert this information to a
a. Relative frequency distribution.
b. Cumulative frequency distribution showing “less than or within” frequencies.
Expert Solution & Answer
Want to see the full answer?
Check out a sample textbook solution
Chapter 2 Solutions
EBK CENGAGENOW FOR WEIERS' INTRODUCTION
Ch. 2.2 - What is a frequency distribution? What benefits...Ch. 2.2 - Prob. 2.2ECh. 2.2 - The National Safety Council reports the following...Ch. 2.2 - Prob. 2.4ECh. 2.2 - Prob. 2.5ECh. 2.2 - Using the frequency distribution in Exercisc 2.5,...Ch. 2.2 - What is meant by the statement that the set of...Ch. 2.2 - For commercial banks in each state, the U.S....Ch. 2.2 - The accompanying data describe the hourly wage...Ch. 2.2 - The following performance scores have been...
Ch. 2.2 - During his career in the NHL, hockey great Wayne...Ch. 2.2 - According to the U.S. Department of Agriculture,...Ch. 2.2 - Convert the distribution in Exercise 2.3 to a...Ch. 2.2 - Prob. 2.14ECh. 2.2 - Using the frequency distribution obtained in...Ch. 2.2 - For the frequency distribution constructed in...Ch. 2.2 - Prob. 2.17ECh. 2.2 - Prob. 2.18ECh. 2.2 - Prob. 2.19ECh. 2.3 - Construct a stem-and-leaf display for the...Ch. 2.3 - Prob. 2.21ECh. 2.3 - In the following stem-and-leaf display for a set...Ch. 2.3 - Prob. 2.23ECh. 2.3 - Prob. 2.24ECh. 2.3 - Prob. 2.25ECh. 2.3 - Prob. 2.26ECh. 2.3 - Prob. 2.28ECh. 2.4 - What is the difference between a histogram and a...Ch. 2.4 - Prob. 2.30ECh. 2.4 - Prob. 2.31ECh. 2.4 - Prob. 2.32ECh. 2.4 - Prob. 2.33ECh. 2.4 - Prob. 2.34ECh. 2.4 - It has been estimated that 92.9% of U.S....Ch. 2.4 - Prob. 2.37ECh. 2.5 - What is a scatterplot, and for what kind of data...Ch. 2.5 - Prob. 2.39ECh. 2.5 - Prob. 2.40ECh. 2.5 - Prob. 2.41ECh. 2.5 - For six local offices of a large tax prepartion...Ch. 2.5 - In the 2009 stress tests applied to the nation’s...Ch. 2.5 - Prob. 2.44ECh. 2.5 - Prob. 2.45ECh. 2.6 - Prob. 2.46ECh. 2.6 - Difference between simple tabulation and...Ch. 2.6 - Prob. 2.48ECh. 2.6 - For the fleet described in Exercise 2.48, a....Ch. 2.6 - Prob. 2.50ECh. 2.6 - Prob. 2.51ECh. 2.6 - Prob. 2.52ECh. 2.6 - Prob. 2.53ECh. 2.6 - Prob. 2.54ECh. 2 - The breakdown of U.S. cities having a population...Ch. 2 - The National Oceanic and Atmospheric...Ch. 2 - Prob. 2.57CECh. 2 - Prob. 2.58CECh. 2 - Prob. 2.59CECh. 2 - Prob. 2.60CECh. 2 - The following stem-and-leaf output has been...Ch. 2 - For the period 2001—2008, the lristol-Myers Squibb...Ch. 2 - Prob. 2.63CECh. 2 - Prob. 2.64CECh. 2 - Prob. 2.65CECh. 2 - Prob. 2.66CECh. 2 - Prob. 2.67CECh. 2 - Prob. 2.68CECh. 2 - Prob. 2.69CECh. 2 - Prob. 2.70CECh. 2 - Using 10-yard intervals beginning with 200.0—under...Ch. 2 - Using the same intervals as in part 1, construct a...Ch. 2 - Prob. 1.3IC
Additional Math Textbook Solutions
Find more solutions based on key concepts
In Exercises 5-36, express all probabilities as fractions.
23. Combination Lock The typical combination lock us...
Elementary Statistics
the proportion of red cars in the sample and display the sampling distribution of the sample proportion on dot ...
PRACTICE OF STATISTICS F/AP EXAM
Four different beverages are sold at a fast-food restaurant: soft drinks, tea, coffee, and bottled water. a. Ex...
Basic Business Statistics, Student Value Edition
(a) For each data set, find the mean, median, and mode. (b) Discuss anything about the data that affects the us...
APPLIED STAT.IN BUS.+ECONOMICS
To explain would this correlation increase, decrease or not change much if we remove the elephants.
Statistics Through Applications
1. How is a sample related to a population?
Elementary Statistics: Picturing the World (6th Edition)
Knowledge Booster


Learn more about
Need a deep-dive on the concept behind this application? Look no further. Learn more about this topic, statistics and related others by exploring similar questions and additional content below.Recommended textbooks for you
 Glencoe Algebra 1, Student Edition, 9780079039897...AlgebraISBN:9780079039897Author:CarterPublisher:McGraw Hill
 Big Ideas Math A Bridge To Success Algebra 1: Stu...AlgebraISBN:9781680331141Author:HOUGHTON MIFFLIN HARCOURTPublisher:Houghton Mifflin Harcourt
 Holt Mcdougal Larson Pre-algebra: Student Edition...AlgebraISBN:9780547587776Author:HOLT MCDOUGALPublisher:HOLT MCDOUGAL
 Functions and Change: A Modeling Approach to Coll...AlgebraISBN:9781337111348Author:Bruce Crauder, Benny Evans, Alan NoellPublisher:Cengage Learning
Glencoe Algebra 1, Student Edition, 9780079039897...
Algebra
ISBN:9780079039897
Author:Carter
Publisher:McGraw Hill
Big Ideas Math A Bridge To Success Algebra 1: Stu...
Algebra
ISBN:9781680331141
Author:HOUGHTON MIFFLIN HARCOURT
Publisher:Houghton Mifflin Harcourt
Holt Mcdougal Larson Pre-algebra: Student Edition...
Algebra
ISBN:9780547587776
Author:HOLT MCDOUGAL
Publisher:HOLT MCDOUGAL
Functions and Change: A Modeling Approach to Coll...
Algebra
ISBN:9781337111348
Author:Bruce Crauder, Benny Evans, Alan Noell
Publisher:Cengage Learning
How to make Frequency Distribution Table / Tally Marks and Frequency Distribution Table; Author: Reenu Math;https://www.youtube.com/watch?v=i_A6RiE8tLE;License: Standard YouTube License, CC-BY
Frequency distribution table in statistics; Author: Math and Science;https://www.youtube.com/watch?v=T7KYO76DoOE;License: Standard YouTube License, CC-BY
Frequency Distribution Table for Grouped/Continuous data | Math Dot Com; Author: Maths dotcom;https://www.youtube.com/watch?v=ErnccbXQOPY;License: Standard Youtube License