Videos
Quantcast.com provides the number of people from the United States who visit a given website. The list below shows the number of U.S. visitors for the 50 most highly visited websites (Quantcast.com website, December 2015). 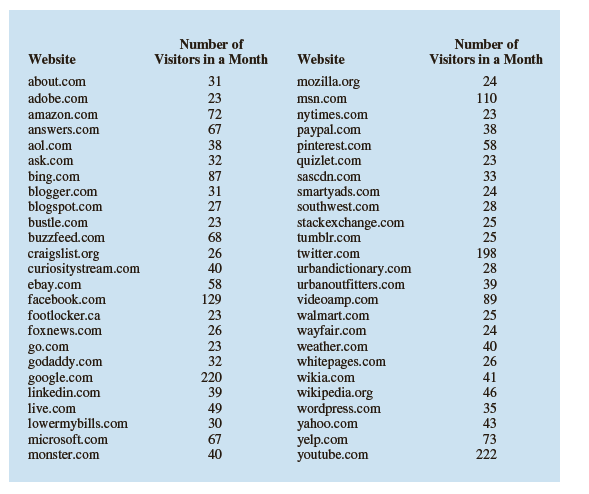
Summarize the data by constructing the following:
a. A frequency distribution (classes in millions: 20-29.999, 30-30.999, and so on).
b. A relative frequency distribution.
c. A cumulative distribution.
d. A cumulative relative frequency distribution.
e. Show a histogram. Comment on the shape of the distribution.
f. What is the website with the most U.S. visitors? How many people from the U.S. visited the site?
Want to see the full answer?
Check out a sample textbook solution
Chapter 2 Solutions
Bundle: Essentials of Modern Business Statistics with Microsoft Office Excel, Loose-leaf Version, 7th + MindTap Business Statistics, 1 term (6 months) Printed Access Card


 Glencoe Algebra 1, Student Edition, 9780079039897...AlgebraISBN:9780079039897Author:CarterPublisher:McGraw Hill
 Holt Mcdougal Larson Pre-algebra: Student Edition...AlgebraISBN:9780547587776Author:HOLT MCDOUGALPublisher:HOLT MCDOUGAL
 Big Ideas Math A Bridge To Success Algebra 1: Stu...AlgebraISBN:9781680331141Author:HOUGHTON MIFFLIN HARCOURTPublisher:Houghton Mifflin Harcourt