
Videos
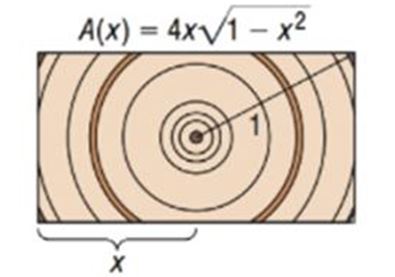
Cross-sectional Area The cross-sectional area of a beam cut from a log with radius 1 foot is given by the function , where represents the length, in feet, of half the base of the beam. See the figure.
(a) Find the domain of A.
(b) Use a graphing utility to graph the function .
(c) Create a TABLE with and for . Which value of maximizes the cross-sectional area? What should be the length of the base of the beam to maximize the cross-sectional area?
Want to see the full answer?
Check out a sample textbook solution
Chapter 2 Solutions
Precalculus
Additional Math Textbook Solutions
Precalculus: Concepts Through Functions, A Unit Circle Approach to Trigonometry (4th Edition)
Glencoe Math Accelerated, Student Edition
Calculus: Single And Multivariable
Precalculus Enhanced with Graphing Utilities (7th Edition)
Calculus 2012 Student Edition (by Finney/Demana/Waits/Kennedy)
Calculus Early Transcendentals, Binder Ready Version


- Magazine Circulation: The circulation C of a certain magazine as a function of time t is given by the formula C=5.20.1+0.3t Here C is measured in thousands, and t is measured in years since the beginning of 2006, when the magazine was started. a. Make a graph of C versus t covering the first 6 years of the magazines existence. b. Express using functional notation the circulation of the magazine 18 months after it was started, and then find that value. c. Over what time interval is the graph of C concave up? Explain your answer in practical terms. d. At what time was the circulation increasing the fastest?. e. Determine the limiting value for C. Explain your answer in practical terms.arrow_forwardReaction Rates In a chemical reaction, the reaction rate R is a function of the concentraton of the product of the reaction. For a certain second-order reaction between two substances, we have the formula R=0.01x2x+22. Here x is measured in moles per cubic meter and R is measured in moles per cubic meter per second. a. Make a graph of R versus x. Include concentrations up to 100 moles per cubic meter. b. Use functional notation to express the reaction rate when the concentration is 15 moles per cubic meter, and then calculate hat value. c. The reaction is said to be in equilibrium when the reaction rate is 0. At what two concentratoins is the reaction in equilibrium?arrow_forwardFluid Flow The intake pipe of a 100-gallon tank has a flow rate of 10 gallons per minute, and two drainpipes have flow rates of 5 gallons per minute each. The figure shows the volume V of fluid in the tank as a function of time t. Determine whether the input pipe and each drainpipe are open or closed in specific subintervals of the 1 hour of time shown in the graph. (There are many correct answers.)arrow_forward
- Strength of a Beam The strength S of a wooden beam of x and depth y is given by formula 13.8xy2 . A beam is to be cut from a log of diameter 10 in., as shown in the figure. (a) Express strength S of this beam as a function of x only. (b) What is domain of the function S? (c) Draw a graph of S. (d) What width will make the beam the strongest?arrow_forwardReaction Time For certain decisions, the time it takes to respond is a logarithmic function of the number of choices faced. One model is, R=0.17+0.44logN where R is the reaction time in seconds and N is the number of choices. a.Draw a graph of R versus N. Include values of N from 1 to 10 choices. b.Using functional notation, express the reaction if there are seven choices, and then calculate that time. c.If the reaction is to be at most 0.5 second, how many choices can there be? d.If the number of choices increases by a factor of 10, what happens to the reaction time. e.Explain in practical terms what the concavity of graph means.arrow_forwardHOW DO YOU SEE IT? The figure shows the graphs of y=lnx,y=lnx2,y=ln2x, and y=ln2. Match each function with its graph. (The graphs are labeled A through D .) Explain.arrow_forward
- Drug Concentration When a drug is administered orally, it takes some time before the blood concentration reaches its maximum level. After that time, concentration levels decrease. When 500 milligrams of procainamide is administered orally, one model for a particular patient gives blood concentration C, in milligrams per liter, after t hours as C=2.65(e0.2te2t) What is the maximum blood-level concentration, and when does that level occur?arrow_forwardA Population of Foxes A breeding group of foxes is introduced into a protected area, and the population growth follws a logistic pattern. After t years, the population of foxes is given by N=37.50.25+0.76t foxes. a. How many foxes were intorduced into the protected area? b. Make a graph of N versus t and explain in words how the populatoin of foxes increases with time. c. When will the fox population reach 100 individuals?arrow_forwardPlanet Growth The amount of growth of plants in an ungrazed pasture is a function of the amount of plant biomass already present and the amount of rainfall. For a pasture in the arid zone of Australia the formula Y=55.120.01535N0.00056N2+3.946R gives an approximation of the growth. Here R is the amount of rainfall, in millimeters, over a 3 month period; N is the plant biomass, in kilograms per hectare, at the beginning of that period; and Y is the growth, in kilograms per hectare, of the biomass over that period. For comparison, 100 millimeters is about 3.9 inches, and 100 kilograms per hectare is about 89 pounds per acre. For this exercise, assume that the amount of plant biomass initially present is 400 kilograms per hectare, so N=400. a. Find a formula for the growth Y as a function of the amount R of rainfall. b. Make a graph of Y versus r. Include values of R from 40 to 160 millimeters. c. What happens to Y as R increases? Explain your answer in practical terms. d. How much growth will there be over a 3 month period if initially there are 400 kilograms per hectare of plant biomass and the amount of rainfall is 100 millimeters?arrow_forward
- Population Growth: The growth G of a population over a week is a function of the population size n at the beginning of the week. If both n and G are measured in thousands of animals, the formula is G=0.25n2+5n, a. Make a graph of G versus n. Include values of n up to 25 thousand animals. b. Use functional notation to express the growth over a week if the population at the beginning is 4 thousand animals, and then calculate that value. c. Calculate G(22) and explain in practical terms what your answer means. d. For what values of n is the function G increasing? Determine whether the graph is concave up or concave down for these values, and explain in practical terms what this means.arrow_forwardAverage Speed: A commuter regularly drives 70 miles from home to work, and the amount of time required for the trip varies widely as a result of road and traffic conditions. The average speed for such a trip is a function of the time required. For example, if the trip takes 2 hours, then the average speed is 70/2 = 35 miles per hour. a. What is the average speed if the trip takes an hour and a half? b. Find a formula for the average speed as a function of the time required for the trip. You need to choose variable and function names. Be sure to state units. c. Make a graph of the average speed as a function of the time required. Includes trips from 1 hour to 3 hours in length. d. Is the graph concave up or concave down? Explain in practical terms what this meansarrow_forwardPopulation Growth The growth G of a population of lower organisms over a day is a function of the population size n at the beginning of the day. If both n and G are measured in thousands of organisms, the formula is G=-0.03n2+n. a. Make a graph of G versus n. Include values of n up to 40 thousand onganisms. b. Calculate G35 and explain in practical terms what your answer means. c. For what two population levels will the population grow by 5 thousand over a day? d. If there is no population to start with, of course there will ne no growth. At what other population level will there be no growth?arrow_forward

 Big Ideas Math A Bridge To Success Algebra 1: Stu...AlgebraISBN:9781680331141Author:HOUGHTON MIFFLIN HARCOURTPublisher:Houghton Mifflin Harcourt
 Functions and Change: A Modeling Approach to Coll...AlgebraISBN:9781337111348Author:Bruce Crauder, Benny Evans, Alan NoellPublisher:Cengage Learning
 Algebra and Trigonometry (MindTap Course List)AlgebraISBN:9781305071742Author:James Stewart, Lothar Redlin, Saleem WatsonPublisher:Cengage Learning
 Trigonometry (MindTap Course List)TrigonometryISBN:9781337278461Author:Ron LarsonPublisher:Cengage Learning
 College AlgebraAlgebraISBN:9781305115545Author:James Stewart, Lothar Redlin, Saleem WatsonPublisher:Cengage Learning