
ESSENTIALS OF STATS LBCC >CI<
2nd Edition
ISBN: 9781323121771
Author: Triola
Publisher: PEARSON C
expand_more
expand_more
format_list_bulleted
Concept explainers
Videos
Textbook Question
Chapter 2.3, Problem 20BSC
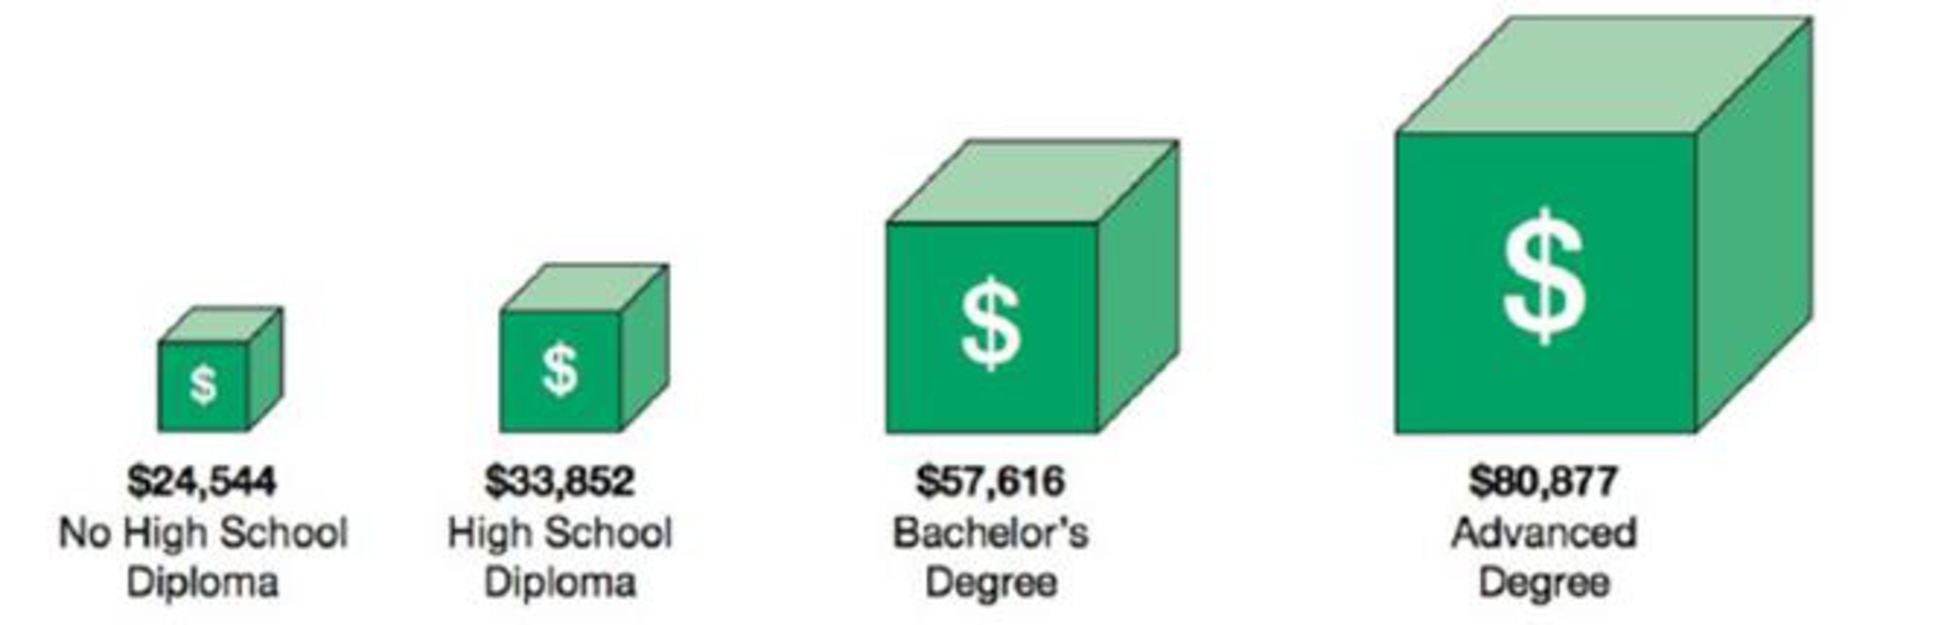
Deceptive Graphs. In Exercises 17-20, identify how the graph is deceptive.
20. Incomes and Academic Degrees The accompanying graph depicts workers with various academic degrees along with their income levels.
Expert Solution & Answer
Want to see the full answer?
Check out a sample textbook solution
Students have asked these similar questions
How do you calculate a break even point in math graph?
Salary after College. In 2010, MonsterCollege surveyed 1250 U.S.college students expecting to graduate in the next several years. Respondents were asked the following question: What do you think your starting salary will be at your first job after college? The line graph shows the percentage of college students who anticipated various starting salaries. Then Solve;
What starting salaries were anticipated by more than 20% of college students?
Question: Which graph represents
y=-3
Chapter 2 Solutions
ESSENTIALS OF STATS LBCC >CI<
Ch. 2.1 - McDonalds Dinner Service Times Refer 10 the...Ch. 2.1 - McDonalds Dinner Service Times Refer to the...Ch. 2.1 - Relative Frequency Distribution Use percentages to...Ch. 2.1 - Whats Wrong? Heights of adult males are known to...Ch. 2.1 - In Exercise 58, identify the class width, class...Ch. 2.1 - In Exercises 58, identify the class width, class...Ch. 2.1 - In Exercises 58, identify the class width, class...Ch. 2.1 - In Exercises 58, identify the class width, class...Ch. 2.1 - Normal Distributions. In Exercises 9 and 10, using...Ch. 2.1 - Normal Distributions. In Exercises 9 and 10, using...
Ch. 2.1 - Constructing Frequency Distributions. In Exercises...Ch. 2.1 - Constructing Frequency Distributions. In Exercises...Ch. 2.1 - Constructing Frequency Distributions. In Exercises...Ch. 2.1 - Burger King Dinner Service Times Refer to Data Set...Ch. 2.1 - Wendys Lunch Service Times Refer to Data Set 25...Ch. 2.1 - Wendys Dinner Service Times Refer to Data Set 25...Ch. 2.1 - Analysis of Last Digits Heights of statistics...Ch. 2.1 - Analysis of Last Digits Weights of respondents...Ch. 2.1 - Oscar Winners Construct one table (similar to...Ch. 2.1 - Blood Platelet Counts Construct one table (similar...Ch. 2.1 - Cumulative Frequency Distributions. In Exercises...Ch. 2.1 - Cumulative Frequency Distributions. In Exercises...Ch. 2.1 - Categorical Data. In Exercises 23 and 24, use the...Ch. 2.1 - Categorical Data. In Exercises 23 and 24, use the...Ch. 2.1 - Large Data Sets. Exercises 2528 involve large sets...Ch. 2.1 - Large Data Sets. Exercises 2528 involve large sets...Ch. 2.1 - Large Data Sets. Exercises 2528 involve large sets...Ch. 2.1 - Large Data Sets. Exercises 2528 involve large sets...Ch. 2.1 - Interpreting Effects of Outliers Refer to Data Set...Ch. 2.2 - Heights Heights of adult males are normally...Ch. 2.2 - More Heights The population of heights of adult...Ch. 2.2 - Blood Platelet Counts Listed below are blood...Ch. 2.2 - Blood Platelet Counts If we collect a sample of...Ch. 2.2 - Interpreting a Histogram. In Exercises 58, answer...Ch. 2.2 - Prob. 6BSCCh. 2.2 - Interpreting a Histogram. In Exercises 58, answer...Ch. 2.2 - Prob. 8BSCCh. 2.2 - Constructing Histograms. In Exercises 9-16,...Ch. 2.2 - Constructing Histograms. In Exercises 9-16,...Ch. 2.2 - Burger King Lunch Service Times Use the frequency...Ch. 2.2 - Burger King Dinner Service Times Use the frequency...Ch. 2.2 - Wendys Lunch Service Times Use the frequency...Ch. 2.2 - Wendys Dinner Service Times Use the frequency...Ch. 2.2 - Analysis of Last Digits Use the frequency...Ch. 2.2 - Analysis of Last Digits Use the frequency...Ch. 2.2 - Back-to-Back Relative Frequency Histograms When...Ch. 2.2 - Interpreting Normal Quantile Plots Which of the...Ch. 2.3 - Body Temperatures Listed below are body...Ch. 2.3 - Voluntary Response Data If we have a large...Ch. 2.3 - Ethics There are data showing that smoking is...Ch. 2.3 - CVDOT Section 2-1 introduced important...Ch. 2.3 - Dotplots. In Exercises 5 and 6, construct the...Ch. 2.3 - Diastolic Blood Pressure Listed below are...Ch. 2.3 - Stem plots. In Exercises 7 and 8, construct the...Ch. 2.3 - Stemplots. In Exercises 7 and 8, construct the...Ch. 2.3 - Time-Series Graphs. In Exercises 9 and 10,...Ch. 2.3 - Time-Series Graphs. In Exercises 9 and 10,...Ch. 2.3 - Pareto Charts. In Exercises 11 and 12 construct...Ch. 2.3 - Pareto Charts. In Exercises 11 and 12 construct...Ch. 2.3 - Pie Charts. In Exercises 13 and 14, construct the...Ch. 2.3 - Pie Charts. In Exercises 13 and 14, construct the...Ch. 2.3 - Frequency Polygon. In Exercises 15 and 16,...Ch. 2.3 - Frequency Polygon. In Exercises 15 and 16,...Ch. 2.3 - Self-Driving Vehicles In a survey of adults,...Ch. 2.3 - Deceptive Graphs. In Exercises 17-20, identify how...Ch. 2.3 - Deceptive Graphs. In Exercises 17-20, identify how...Ch. 2.3 - Deceptive Graphs. In Exercises 17-20, identify how...Ch. 2.3 - Expanded Stemplots A stemplot can be condensed by...Ch. 2.4 - Linear Correlation In this section we use r to...Ch. 2.4 - Causation A study has shown that there is a...Ch. 2.4 - Scanerplot What is a scatterplot and how does it...Ch. 2.4 - Estimating r For each of the following, estimate...Ch. 2.4 - Scatterplot. In Exercises 5-8, use the sample data...Ch. 2.4 - Scatterplot. In Exercises 5-8, use the sample data...Ch. 2.4 - Scatterplot. In Exercises 5-8, use the sample data...Ch. 2.4 - Scatterplot. In Exercises 5-8, use the sample data...Ch. 2.4 - Linear Correlation Coefficient In Exercises 9-12,...Ch. 2.4 - Linear Correlation Coefficient In Exercises 9-12,...Ch. 2.4 - Linear Correlation Coefficient In Exercises 9-12,...Ch. 2.4 - Using the data from Exercise 8 Heights of Fathers...Ch. 2.4 - Prob. 13BBCh. 2.4 - P-Values In Exercises 13-16, write a statement...Ch. 2.4 - P-Values In Exercises 13-16, write a statement...Ch. 2.4 - P-Values In Exercises 13-16, write a statement...Ch. 2 - Cookies Refer to the accompanying frequency...Ch. 2 - Cookies Using the same frequency distribution from...Ch. 2 - Cookies Using the same frequency distribution from...Ch. 2 - Cookies A stemplot of the same cookies summarized...Ch. 2 - Computers As a quality control manager at Texas...Ch. 2 - Distribution of Wealth In recent years, there has...Ch. 2 - Health Test In an investigation of a relationship...Ch. 2 - Lottery In Floridas Play 4 lottery game, four...Ch. 2 - Seatbelts The Beams Seatbelts company...Ch. 2 - Seatbelts A histogram is to be constructed from...Ch. 2 - Frequency Distribution of Body Temperatures...Ch. 2 - Histogram of Body Temperatures Construct the...Ch. 2 - Dotplot of Body Temperatures Construct a dotplot...Ch. 2 - Stemplot of Body Temperatures Construct a stemplot...Ch. 2 - Body Temperatures Listed below are the...Ch. 2 - Environment a. After collecting the average (mean)...Ch. 2 - Its Like Time Do This Exercise In a Marist survey...Ch. 2 - Whatever Use the same data from Exercise 7 to...Ch. 2 - In Exercises 1-6 refer to the data below, which...Ch. 2 - Frequency Distribution For the frequency...Ch. 2 - In Exercises 1-6, refer to the data below, which...Ch. 2 - In Exercises 1-6, refer to the data below, which...Ch. 2 - In Exercises 1-6, refer to the data below, which...Ch. 2 - Data Type a. The listed playing times are all...Ch. 2 - It was stated in this chapter that the days of...Ch. 2 - Fast Food Restaurant Drive-Through Service Times:...
Knowledge Booster


Learn more about
Need a deep-dive on the concept behind this application? Look no further. Learn more about this topic, statistics and related others by exploring similar questions and additional content below.Similar questions
- Prepare a table and line graph showing the unemployment and economic growth rate for Barbados and developed country Canada for the last 5 years. Examine the relationship observed between the two countries. b) Identify THREE public policies that can stimulate employment and facilitate economic growth in an economy. Use examples to clearly illustrate how EACH policy can stimulate employment and facilitate economic growth in your country.arrow_forwardWhat are the two balancing factors you should consider when you are resizing a typical chart or graph.arrow_forward
Recommended textbooks for you
 Big Ideas Math A Bridge To Success Algebra 1: Stu...AlgebraISBN:9781680331141Author:HOUGHTON MIFFLIN HARCOURTPublisher:Houghton Mifflin Harcourt
 Glencoe Algebra 1, Student Edition, 9780079039897...AlgebraISBN:9780079039897Author:CarterPublisher:McGraw Hill
 Algebra: Structure And Method, Book 1AlgebraISBN:9780395977224Author:Richard G. Brown, Mary P. Dolciani, Robert H. Sorgenfrey, William L. ColePublisher:McDougal Littell
Big Ideas Math A Bridge To Success Algebra 1: Stu...
Algebra
ISBN:9781680331141
Author:HOUGHTON MIFFLIN HARCOURT
Publisher:Houghton Mifflin Harcourt
Glencoe Algebra 1, Student Edition, 9780079039897...
Algebra
ISBN:9780079039897
Author:Carter
Publisher:McGraw Hill
Algebra: Structure And Method, Book 1
Algebra
ISBN:9780395977224
Author:Richard G. Brown, Mary P. Dolciani, Robert H. Sorgenfrey, William L. Cole
Publisher:McDougal Littell
The Shape of Data: Distributions: Crash Course Statistics #7; Author: CrashCourse;https://www.youtube.com/watch?v=bPFNxD3Yg6U;License: Standard YouTube License, CC-BY
Shape, Center, and Spread - Module 20.2 (Part 1); Author: Mrmathblog;https://www.youtube.com/watch?v=COaid7O_Gag;License: Standard YouTube License, CC-BY
Shape, Center and Spread; Author: Emily Murdock;https://www.youtube.com/watch?v=_YyW0DSCzpM;License: Standard Youtube License