
Elementary Statistics Using The Ti-83/84 Plus Calculator, Books A La Carte Edition (5th Edition)
5th Edition
ISBN: 9780134688886
Author: Mario F. Triola
Publisher: PEARSON
expand_more
expand_more
format_list_bulleted
Concept explainers
Videos
Textbook Question
Chapter 2.3, Problem 20BSC
Deceptive Graphs. In Exercises 17-20, identify how the graph is deceptive.
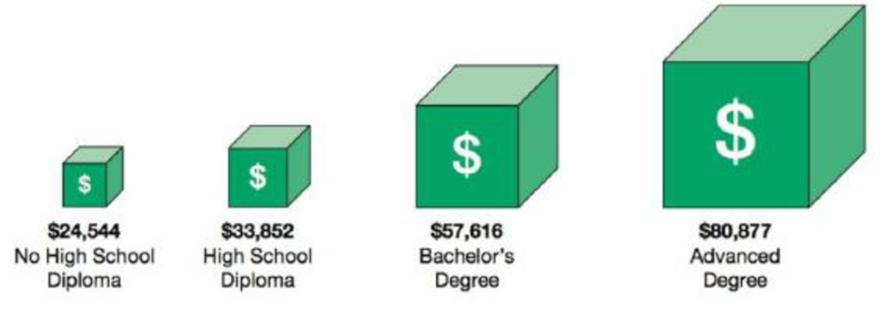
20. Incomes and Academic Degrees The accompanying graph depicts workers with various academic degrees along with their income levels.
Expert Solution & Answer
Want to see the full answer?
Check out a sample textbook solution
Students have asked these similar questions
How do you calculate a break even point in math graph?
Salary after College. In 2010, MonsterCollege surveyed 1250 U.S.college students expecting to graduate in the next several years. Respondents were asked the following question: What do you think your starting salary will be at your first job after college? The line graph shows the percentage of college students who anticipated various starting salaries. Then Solve;
What starting salaries were anticipated by more than 20% of college students?
Question: Which graph represents
y=-3
Chapter 2 Solutions
Elementary Statistics Using The Ti-83/84 Plus Calculator, Books A La Carte Edition (5th Edition)
Ch. 2.1 - Prob. 1BSCCh. 2.1 - Prob. 2BSCCh. 2.1 - Prob. 3BSCCh. 2.1 - Prob. 4BSCCh. 2.1 - Prob. 5BSCCh. 2.1 - Prob. 6BSCCh. 2.1 - Prob. 7BSCCh. 2.1 - Prob. 8BSCCh. 2.1 - Prob. 9BSCCh. 2.1 - Prob. 10BSC
Ch. 2.1 - Prob. 11BSCCh. 2.1 - Prob. 12BSCCh. 2.1 - Prob. 13BSCCh. 2.1 - Prob. 14BSCCh. 2.1 - Prob. 15BSCCh. 2.1 - Constructing Frequency Distributions. In Exercises...Ch. 2.1 - Constructing Frequency Distributions. In Exercises...Ch. 2.1 - Prob. 18BSCCh. 2.1 - Prob. 19BSCCh. 2.1 - Relative Frequencies for Comparisons. In Exercises...Ch. 2.1 - Prob. 21BSCCh. 2.1 - Prob. 22BSCCh. 2.1 - Prob. 23BSCCh. 2.1 - Prob. 24BSCCh. 2.1 - Large Data Sets. Exercises 2528 involve large sets...Ch. 2.1 - Prob. 26BSCCh. 2.1 - Prob. 27BSCCh. 2.1 - Prob. 28BSCCh. 2.1 - Prob. 29BBCh. 2.2 - Prob. 1BSCCh. 2.2 - Prob. 2BSCCh. 2.2 - Blood Platelet Counts Listed below are blood...Ch. 2.2 - Prob. 4BSCCh. 2.2 - Interpreting a Histogram. In Exercises 5-8, answer...Ch. 2.2 - Prob. 6BSCCh. 2.2 - Prob. 7BSCCh. 2.2 - Prob. 8BSCCh. 2.2 - Prob. 9BSCCh. 2.2 - Constructing Histograms. In Exercises 916,...Ch. 2.2 - Constructing Histograms. In Exercises 916,...Ch. 2.2 - Constructing Histograms. In Exercises 916,...Ch. 2.2 - Prob. 13BSCCh. 2.2 - Prob. 14BSCCh. 2.2 - Prob. 15BSCCh. 2.2 - Prob. 16BSCCh. 2.2 - Prob. 17BBCh. 2.2 - Prob. 18BBCh. 2.3 - Prob. 1BSCCh. 2.3 - Prob. 2BSCCh. 2.3 - Prob. 3BSCCh. 2.3 - Prob. 4BSCCh. 2.3 - Prob. 9BSCCh. 2.3 - Prob. 10BSCCh. 2.3 - Frequency Polygon. In Exercises 15 and 16,...Ch. 2.3 - Frequency Polygon. In Exercises 15 and 16,...Ch. 2.3 - Prob. 17BSCCh. 2.3 - Deceptive Graphs. In Exercises 17-20, identify how...Ch. 2.3 - Prob. 19BSCCh. 2.3 - Deceptive Graphs. In Exercises 17-20, identify how...Ch. 2.4 - Linear Correlation In this section we use r to...Ch. 2.4 - Prob. 2BSCCh. 2.4 - Prob. 3BSCCh. 2.4 - Prob. 4BSCCh. 2.4 - Scatterplot. In Exercises 58, use the sample data...Ch. 2.4 - Prob. 6BSCCh. 2.4 - Prob. 7BSCCh. 2.4 - Prob. 8BSCCh. 2.4 - Prob. 9BSCCh. 2.4 - Linear Correlation Coefficient In Exercises 9-12,...Ch. 2.4 - Prob. 11BSCCh. 2.4 - Prob. 12BSCCh. 2.4 - Prob. 13BBCh. 2.4 - P-Values In Exercises 13-16, write a statement...Ch. 2.4 - Prob. 15BBCh. 2.4 - Prob. 16BBCh. 2 - Cookies Refer to the accompanying frequency...Ch. 2 - Cookies Using the same frequency distribution from...Ch. 2 - Prob. 3CQQCh. 2 - Cookies A stemplot of the same cookies summarized...Ch. 2 - Computers As a quality control manager at Texas...Ch. 2 - Prob. 6CQQCh. 2 - Prob. 7CQQCh. 2 - Prob. 8CQQCh. 2 - Prob. 9CQQCh. 2 - Prob. 10CQQCh. 2 - Frequency Distribution of Body Temperatures...Ch. 2 - Prob. 2RECh. 2 - Prob. 5RECh. 2 - Prob. 6RECh. 2 - Prob. 1CRECh. 2 - In Exercises 1-6, refer to the data below, which...Ch. 2 - Prob. 3CRECh. 2 - Prob. 4CRECh. 2 - Prob. 6CRECh. 2 - Prob. 1TPPCh. 2 - Fast Food Restaurant Drive-Through Service Times:...Ch. 2 - Prob. 2FDDCh. 2 - Fast Food Restaurant Drive-Through Service Times:...Ch. 2 - Prob. 4FDDCh. 2 - Prob. 5FDD
Knowledge Booster


Learn more about
Need a deep-dive on the concept behind this application? Look no further. Learn more about this topic, statistics and related others by exploring similar questions and additional content below.Similar questions
- Prepare a table and line graph showing the unemployment and economic growth rate for Barbados and developed country Canada for the last 5 years. Examine the relationship observed between the two countries. b) Identify THREE public policies that can stimulate employment and facilitate economic growth in an economy. Use examples to clearly illustrate how EACH policy can stimulate employment and facilitate economic growth in your country.arrow_forwardWhat are the two balancing factors you should consider when you are resizing a typical chart or graph.arrow_forward
Recommended textbooks for you
 Big Ideas Math A Bridge To Success Algebra 1: Stu...AlgebraISBN:9781680331141Author:HOUGHTON MIFFLIN HARCOURTPublisher:Houghton Mifflin Harcourt
 Glencoe Algebra 1, Student Edition, 9780079039897...AlgebraISBN:9780079039897Author:CarterPublisher:McGraw Hill
 Algebra: Structure And Method, Book 1AlgebraISBN:9780395977224Author:Richard G. Brown, Mary P. Dolciani, Robert H. Sorgenfrey, William L. ColePublisher:McDougal Littell
Big Ideas Math A Bridge To Success Algebra 1: Stu...
Algebra
ISBN:9781680331141
Author:HOUGHTON MIFFLIN HARCOURT
Publisher:Houghton Mifflin Harcourt
Glencoe Algebra 1, Student Edition, 9780079039897...
Algebra
ISBN:9780079039897
Author:Carter
Publisher:McGraw Hill
Algebra: Structure And Method, Book 1
Algebra
ISBN:9780395977224
Author:Richard G. Brown, Mary P. Dolciani, Robert H. Sorgenfrey, William L. Cole
Publisher:McDougal Littell
The Shape of Data: Distributions: Crash Course Statistics #7; Author: CrashCourse;https://www.youtube.com/watch?v=bPFNxD3Yg6U;License: Standard YouTube License, CC-BY
Shape, Center, and Spread - Module 20.2 (Part 1); Author: Mrmathblog;https://www.youtube.com/watch?v=COaid7O_Gag;License: Standard YouTube License, CC-BY
Shape, Center and Spread; Author: Emily Murdock;https://www.youtube.com/watch?v=_YyW0DSCzpM;License: Standard Youtube License