
Concept explainers
Videos
(Modeling) Speed of Light When a light ray travels from one medium, such as air, to another medium, such as water or glass, the speed of the light changes, and the light ray is bent, or refracted, at the boundary between the two media. (This is why objects under water appear to be in a different position from where they really are.) It can be shown in physics that these changes are related by Snell's law
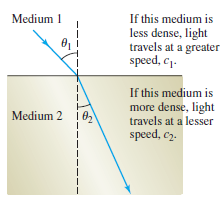
where c1 is the speed of light in the first medium, c2 is the speed of light in the second medium, and θ1 and θ 2 are the
Find the speed of light in the second medium for each of the following.
(a)
(b)
Want to see the full answer?
Check out a sample textbook solution
Chapter 2 Solutions
TRIGONOMETRY MSU CUSTOM W/MML


- Meteorology The speed of the wind S (in miles per hour) near the center of a tornado and the distance d (in miles) the tornado travels are related by the model S=93logd+65. On March 18, 1925, a large tornado struck portions of Missouri, Illinois, and Indiana with a wind speed at the center of about 283 miles per hour. Approximate the distance travelled by this tornadoarrow_forwardStopping distance, The stopping distance of an automobile is the distance travelled during the driver’s reaction time plus the distance travelled after the driver applies the brakes. In an experiment, researchers measured these distances (in feet) when the automobile was traveling at a speed of x. miles per hour on dry, level pavement, as shown in the bar graph. The distance travelled during the reaction time R was R=1.1x and the braking distance B was B=0.0475x20.001x+0.23. (a) Determine the polynomial that represents the total stopping distance T. (b) Use the result of part (a) to estimate the total stopping distance when x=30,x=40, andx=55 miles per hour. (c) Use the bar graph to make a statement about the total stopping distance required forincreasing speeds.arrow_forwardThe Beer-Lambert Law As sunlight passes through the waters of lakes and oceans, the light is absorbed, and the deeper it penetrates, the more its intensity diminishes. The light intensity I at depth x is given by the Beer-Lambert Law: I=I0ekx where I0 is the light intensity at the surface and k is a constant that depends on the murkiness of the water see page 402. A biologist uses a photometer to investigate light penetration in a northern lake, obtaining the data in the table. Light intensity decreases exponentially with depth. Use a graphing calculator to find an exponential function of the form given by the Beer-Lambert Law to model these data. What is the light intensity I0 at the surface on this day, and what is the murkiness constant k for this lake? Hint: If your calculator gives you a function of the form I=abx, convert this to the form you want using the identities bx=eln(bx)=exlnb. See Example 1b. Make a scatter plot of the data, and graph the function that you found in part a on your scatter plot. If the light intensity drops below 0.15 lumen lm, a certain species of algae cant survive because photosynthesis is impossible. Use your model from part a to determine the depth below which there is insufficient light to support this algae. Depth ft Light intensity lm Depth ft Light intensity lm 5 10 15 20 13.0 7.6 4.5 2.7 25 30 35 40 1.8 1.1 0.5 0.3arrow_forward
- Physics Experiment Consider a physics laboratory experiment designed to determine an unknown mass. A flexible metal meter stick is clamped to a table with 50 centimeters overhanging the edge (see figure). Known masses Mranging from 200grams to 2000grams are attached to the end of the meter stick. For each mass, the meter stick is displaced vertically and then allowed to oscillate. The average time t(in seconds) of one oscillation for each mass is recorded in the table. A model for the data that can be used to predict the time of one oscillation is t=38M+16,96510(M+5000). (a) Use this model to create a table showing the predicted time for each of the masses shown in the table above. (b) Compare the predicted times with the experimental times. What can you conclude? (c) Use the model to approximate the mass of an object for which t=1.056seconds.arrow_forwardPopulation The population P (in millions) of Italy from 2003 through 2015 can be approximated by the model P=57.59e0.0051t, where t represents the year, with t=3 corresponding to 2003. (a) According to the model, is the population of Italy increasing or decreasing? Explain. (b) Find the populations of Italy in 2003 and 2015. (c) Use the model to predict the populations of Italy in 2020 and 2025.arrow_forward

 Trigonometry (MindTap Course List)TrigonometryISBN:9781337278461Author:Ron LarsonPublisher:Cengage Learning
 College AlgebraAlgebraISBN:9781305115545Author:James Stewart, Lothar Redlin, Saleem WatsonPublisher:Cengage Learning
 Algebra and Trigonometry (MindTap Course List)AlgebraISBN:9781305071742Author:James Stewart, Lothar Redlin, Saleem WatsonPublisher:Cengage Learning
 Algebra & Trigonometry with Analytic GeometryAlgebraISBN:9781133382119Author:SwokowskiPublisher:Cengage