Elementary Statistics With Mystatlab
12th Edition
ISBN: 9780321932921
Author: Triola
Publisher: PEARSON
expand_more
expand_more
format_list_bulleted
Videos
Textbook Question
Chapter 2.4, Problem 10BSC
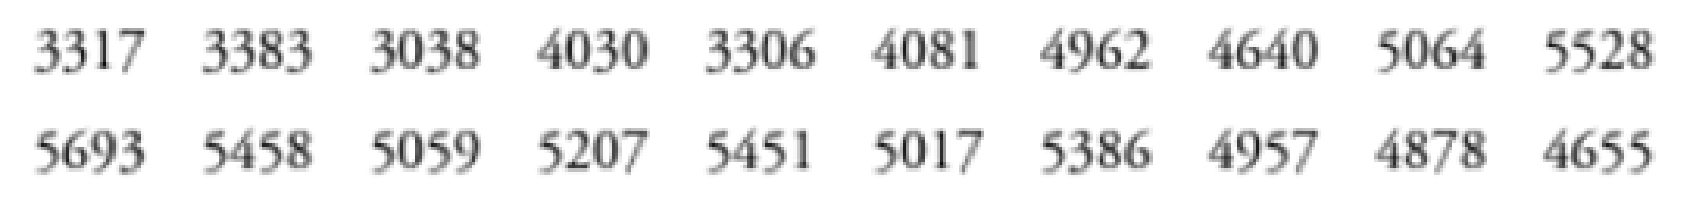
Time-Series Graphs. In Exercises 9 and 10, construct the time-series graph.
10. Home Runs Listed below are the numbers of home runs in major league baseball for each year beginning with 1990 (listed in order by row). Is there a trend?
Expert Solution & Answer
Want to see the full answer?
Check out a sample textbook solution
Students have asked these similar questions
A time series that shows a recurring pattern over one year or less is said to follow a a. horizontal pattern. b. stationary pattern. c. seasonal pattern. d. cyclical pattern
Time-Series Graphs. In Exercises 9 and 10, construct the time-series graph.
Home Runs Listed below are the numbers of home runs in Major League Baseball for each year beginning with 1990 (listed in order by row). Is there a trend?
The elevation of a lake surface (feet above sea level) varies according to the annual flow of a river that feeds it. A geological survey provided the following data from equally spaced intervals of time over a 15 year period.
Time Period
Elevation
1
4817
2
4819
3
4824
4
4822
5
4826
6
4831
7
4836
8
4837
9
4839
10
4837
11
4832
12
4827
13
4823
14
4818
15
4817
Make a time-series graph displaying the data.
Chapter 2 Solutions
Elementary Statistics With Mystatlab
Ch. 2.2 - Frequency Distribution Table 2-2 on page 45 is a...Ch. 2.2 - Relative Frequency Distribution After construction...Ch. 2.2 - Do You Believe? In a Harris Interactive survey,...Ch. 2.2 - Analyzing a Frequency Distribution The...Ch. 2.2 - In Exercises 5-10, identify the class width, class...Ch. 2.2 - In Exercises 5-10, identify the class width, class...Ch. 2.2 - In Exercises 5-10, identify the class width, class...Ch. 2.2 - In Exercises 5-10, identify the class width, class...Ch. 2.2 - In Exercises 5-10, identify the class width, class...Ch. 2.2 - In Exercises 5-10, identify the class width, class...
Ch. 2.2 - Normal Distributions. In Exercises 11-14, answer...Ch. 2.2 - Normal Distributions. In Exercises 11-14, answer...Ch. 2.2 - Normal Distributions. In Exercises 11-14, answer...Ch. 2.2 - Normal Distributions. In Exercises 11-14, answer...Ch. 2.2 - Relative Frequencies for Comparisons. In Exercises...Ch. 2.2 - Relative Frequencies for Comparisons. In Exercises...Ch. 2.2 - Cumulative Frequency Distributions. In Exercises...Ch. 2.2 - Cumulative Frequency Distributions. In Exercises...Ch. 2.2 - Analysis of Last Digits Heights of statistics...Ch. 2.2 - Analysis of Last Digits Weights of respondents...Ch. 2.2 - Constructing Frequency Distributions. In Exercises...Ch. 2.2 - Constructing Frequency Distributions. In Exercises...Ch. 2.2 - Constructing Frequency Distributions. In Exercises...Ch. 2.2 - Constructing Frequency Distributions. In Exercises...Ch. 2.2 - Constructing Frequency Distributions. In Exercises...Ch. 2.2 - Constructing Frequency Distributions. In Exercises...Ch. 2.2 - Constructing Frequency Distributions. In Exercises...Ch. 2.2 - Constructing Frequency Distributions. In Exercises...Ch. 2.2 - Categorical Data. In Exercises 29-32, use the...Ch. 2.2 - Categorical Data. In Exercises 29-32, use the...Ch. 2.2 - Categorical Data. In Exercises 29-32, use the...Ch. 2.2 - Categorical Data. In Exercises 29-32, use the...Ch. 2.2 - Interpreting Effects of Outliers Refer to Data Set...Ch. 2.2 - Number of Classes According to what is known as...Ch. 2.3 - Prob. 1BSCCh. 2.3 - Voluntary Response Sample The histogram in Figure...Ch. 2.3 - Small Data NASA provides these duration times (in...Ch. 2.3 - Normal Distribution When it refers to a normal...Ch. 2.3 - Interpreting a Histogram. In Exercises 5-8, answer...Ch. 2.3 - Interpreting a Histogram. In Exercises 5-8, answer...Ch. 2.3 - Interpreting a Histogram. In Exercises 5-8, answer...Ch. 2.3 - Interpreting a Histogram. In Exercises 5-8, answer...Ch. 2.3 - Analysis of Last Digits Use the frequency...Ch. 2.3 - Analysis of Last Digits Use the frequency...Ch. 2.3 - Constructing Histograms. In Exercises 9-18,...Ch. 2.3 - Constructing Histograms. In Exercises 9-18,...Ch. 2.3 - Constructing Histograms. In Exercises 9-18,...Ch. 2.3 - Constructing Histograms. In Exercises 9-18,...Ch. 2.3 - Prob. 15BSCCh. 2.3 - Constructing Histograms. In Exercises 9-18,...Ch. 2.3 - Constructing Histograms. In Exercises 9-18,...Ch. 2.3 - Constructing Histograms. In Exercises 9-18,...Ch. 2.3 - Back-to-Back Relative Frequency Histograms When...Ch. 2.3 - Interpreting a Histogram. In Exercises 5-8, answer...Ch. 2.4 - Bar Chart and Pareto Chart A bar chart and a...Ch. 2.4 - Scatterplot What is a scatterplot? What type of...Ch. 2.4 - SAT Scores Listed below are SAT scores from a...Ch. 2.4 - SAT Scores Given that the data in Exercise 3 were...Ch. 2.4 - Scatterplots. In Exercises 5-8, use the given...Ch. 2.4 - Scatterplots. In Exercises 5-8, use the given...Ch. 2.4 - Scatterplots. In Exercises 5-8, use the given...Ch. 2.4 - Scatterplots. In Exercises 5-8, use the given...Ch. 2.4 - Time-Series Graphs. In Exercises 9 and 10,...Ch. 2.4 - Time-Series Graphs. In Exercises 9 and 10,...Ch. 2.4 - Dotplots. In Exercises II and 12, construct the...Ch. 2.4 - Dotplots. In Exercises 11 and 12, construct the...Ch. 2.4 - Stemplots. In Exercises 13 and 14, construct the...Ch. 2.4 - Stemplots. In Exercises 13 and 14, construct the...Ch. 2.4 - Pareto Charts. In Exercises 15 and 16, construct...Ch. 2.4 - Pareto Charts. In Exercises 15 and 16, construct...Ch. 2.4 - Pie Charts. In Exercises 17 and 18, construct the...Ch. 2.4 - Pie Charts. In Exercises 17 and 18, construct the...Ch. 2.4 - Frequency Polygon. In Exercises 19 and 20,...Ch. 2.4 - Frequency Polygon. In Exercises 19 and 20,...Ch. 2.4 - Deceptive Graphs. In Exercises 21-24, identify the...Ch. 2.4 - Deceptive Graphs. In Exercises 21-24, identify the...Ch. 2.4 - Deceptive Graphs. In Exercises 21-24, identify the...Ch. 2.4 - Deceptive Graphs. In Exercises 21-24, identify the...Ch. 2.4 - Back-to-Back Stemplots Exercise 19 in Section 2-3...Ch. 2 - When one is constructing a table representing the...Ch. 2 - When one is constructing a table representing the...Ch. 2 - When one is constructing a table representing the...Ch. 2 - A stemplot is created from the intervals (min)...Ch. 2 - In the California Daily 4 lottery, four digits...Ch. 2 - In an investigation of the travel costs of college...Ch. 2 - In an investigation of the relationship between...Ch. 2 - As a quality control manager at Sony, you find...Ch. 2 - What characteristic of a data set can be better...Ch. 2 - A histogram is to be constructed from the brain...Ch. 2 - Frequency Distribution of Brain Volumes Construct...Ch. 2 - Histogram of Brain Volumes Construct the histogram...Ch. 2 - Dotplot of California Lottery In the California...Ch. 2 - Stemplot of IQ Scores Listed below are the first...Ch. 2 - CO Emissions Listed below are the amounts (million...Ch. 2 - CO and NO Emissions Exercise 5 lists the amounts...Ch. 2 - Sports Equipment According to USA Today, the...Ch. 2 - In Exercises 1-5, refer to the table in the...Ch. 2 - In Exercises 1-5, refer to the table in the...Ch. 2 - In Exercises 1-5, refer to the table in the...Ch. 2 - In Exercises 1-5, refer to the table in the...Ch. 2 - In Exercises 1-5, refer to the table in the...Ch. 2 - Grooming Time Listed below are times (minutes)...Ch. 2 - Histogram of Grooming Times Use the frequency...Ch. 2 - Stemplot of Grooming Times Use the data from...Ch. 2 - Technology Project It was noted in this section...Ch. 2 - Flight Planning Data Set 15 in Appendix B includes...Ch. 2 - Prob. 2FDDCh. 2 - Flight Planning Data Set 15 in Appendix B includes...
Knowledge Booster


Learn more about
Need a deep-dive on the concept behind this application? Look no further. Learn more about this topic, statistics and related others by exploring similar questions and additional content below.Similar questions
- Table 6 shows the year and the number ofpeople unemployed in a particular city for several years. Determine whether the trend appears linear. If so, and assuming the trend continues, in what year will the number of unemployed reach 5 people?arrow_forward40. In the theory of time series, earthquakes can be considered as a. Secular Trend b. Cyclical Variation c. Seasonal Variation d. Irregular Variationsarrow_forwardIn the theory of time series, earthquakes can be considered as a. Seasonal Variation b. Cyclical Variation c. Irregular Variations d. Secular Trendarrow_forward
- corporate triple-a bond interest rates for 12 consecutive months follow.9.5 9.3 9.4 9.6 9.8 9.7 9.8 10.5 9.9 9.7 9.6 9.6a. construct a time series plot. What type of pattern exists in the data?b. develop three-month and four-month moving averages for this time series. does thethree-month or four-month moving average provide more accurate forecasts basedon MSe? explain.arrow_forwardTime series analysis question: Show that differencing a series to remove a linear trend and a four period cycle is the same as removing the cycle then the trend.arrow_forwardTime series data usually shows a pattern, which is caused by a systematic and unsystematic pattern.arrow_forward
- Time-Series Graphs. In Exercises 9 and 10, construct the time-series graph. Gender Pay Gap Listed below are women’s median earnings as a percentage of men’s median earnings for recent years beginning with 1990. Is there a trend? How does it appear to affect women?arrow_forwardcorporate triple-a bond interest rates for 12 consecutive months follow.9.5 9.3 9.4 9.6 9.8 9.7 9.8 10.5 9.9 9.7 9.6 9.6a. construct a time series plot. What type of pattern exists in the data?b. develop three-month and four-month moving averages for this time series. does thethree-month or four-month moving average provide more accurate forecasts basedon MSe? explain.c. What is the moving average forecast for the next month?arrow_forwardDiscuss whether you believe time series to be an effective forecasting tool. Identify two of the most common mistakes made in completing a time series forecast and share an example of each mistake.arrow_forward
- The Seneca Children’s Fund (SCC) is a local charity that runs a summer camp for disadvantagedchildren. The fund’s board of directors has been working very hard over recentyears to decrease the amount of overhead expenses, a major factor in how charities arerated by independent agencies. The following data show the percentage of the money SCChas raised that was spent on administrative and fund-raising expenses over the last sevenyears. a. Construct a time series plot. What type of pattern exists in the data?b. Use simple linear regression analysis to find the parameters for the line that minimizesMSE for this time series.c. Forecast the percentage of administrative expenses for year 8.d. If SCC can maintain its current trend in reducing administrative expenses, how longwill it take SCC to achieve a level of 5 percent or less?arrow_forwardThe time-series component that exhibits fluctuations over many years above and below the trend is _______. Multiple Choice irregular cycles seasonality autocorrelationarrow_forwardA statistical program is recommended. The number of users of a certain website (in millions) from 2004 through 2011 follows. Year Period Users (Millions) 2004 1 1 2005 2 7 2006 3 11 2007 4 57 2008 5 146 2009 6 359 2010 7 609 2011 8 845 (a) Construct a time series plot. A time series plot contains a series of 8 points connected by line segments. The horizontal axis ranges from 0 to 10 and is labeled: Period. The vertical axis ranges from 0 to 900 and is labeled: Millions of Users. The first point is at approximately (1, 850). The rest are plotted from left to right at regular increments of 1 period in a downward, diagonal direction that doesn't appear to become more or less steep as period increases. The last point is at approximately (8, 0). A time series plot contains a series of 8 points connected by line segments. The horizontal axis ranges from 0 to 10 and is labeled: Period. The vertical axis ranges from 0 to 900 and is labeled: Millions of Users.…arrow_forward
arrow_back_ios
SEE MORE QUESTIONS
arrow_forward_ios
Recommended textbooks for you

Time Series Analysis Theory & Uni-variate Forecasting Techniques; Author: Analytics University;https://www.youtube.com/watch?v=_X5q9FYLGxM;License: Standard YouTube License, CC-BY
Operations management 101: Time-series, forecasting introduction; Author: Brandoz Foltz;https://www.youtube.com/watch?v=EaqZP36ool8;License: Standard YouTube License, CC-BY