
Videos
Adequate information:
Opening value of saving 1,48,000
Closing value of saving 1,98,000
To compute: Dollar weighted average return.
Introduction: Dollar weighted average return is a way to measure an investment’s performance.
Explanation of Solution
Assuming that an investment was made for $148,000.
Thus, all the values in addition and investment in account are considered as outflow of cash flow and all the values of withdrawal and final value are considered as inflow of cash.
PV of inflow = PV of outflow
IRR can be computed using the following formula in excel:
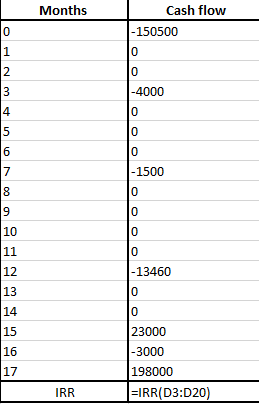
Following is the calculated answer using the above mentioned formula:
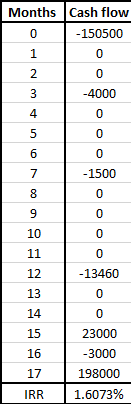
The above return has been calculated on monthly basis.
So, as per the question the dollar weighted average return between first and last date can be calculated by multiplying it by 17 (1/1/2016-5/3/2017)
Dollar weight average return is 27.32%
Want to see more full solutions like this?
Chapter 24 Solutions
INVESTMENTS (LL)


- Compute for the amount of Revenue from Monthly clients.arrow_forwardAll of the accounts payable are for inventory purchases and all inventory items are purchased on account. What are the estimated cash disbursements for inventories for the budget period?arrow_forwardThe following select financial statement information from Vortex Computing. Compute the accounts receivable turnover ratios and the number of days sales in receivables ratios for 2018 and 2019 (round answers to two decimal places). What do the outcomes tell a potential investor about Vortex Computing if industry average for accounts receivable turnover ratio is 4 times and days sales in receivables ratio is 85 days?arrow_forward
- What is the estimated amount of cash receipts from accounts receivable collections in august?arrow_forwardplease help answer Complete the two tables below using the information provided and assume a VAT rate of 15%arrow_forwardThe journal entry to record payment of monthly bill will include:(a) Debit monthly bill and Credit capital.(b) Debit capital and Credit cash.(c) Debit monthly bill and Credit cash.(d) Debit monthly bill and Credit creditors.arrow_forward
- Consider again the example introduced in Section 4.5 of a credit card company that has a database of information provided by its customers when the customers apply for credit cards. An analyst has created a multiple regression model for which the dependent variable in the model is credit card charges accrued by a customer in the data set over the past year (y), and the independent variables are the customers annual household income (x1), number of members of the household (x2), and number of years of posthigh school education (x3). Figure 4.23 provides Excel output for a multiple regression model estimated using a data set the company created. a. Estimate the corresponding simple linear regression with the customers annual household income as the independent variable and credit card charges accrued by a customer over the past year as the dependent variable. Interpret the estimated relationship between the customers annual household income and credit card charges accrued over the past year. How much variation in credit card charges accrued by a customer over the past year does this simple linear regression model explain? b. Estimate the corresponding simple linear regression with the number of members in the customers household as the independent variable and credit card charges accrued by a customer over the past year as the dependent variable. Interpret the estimated relationship between the number of members in the customers household and credit card charges accrued over the past year. How much variation in credit card charges accrued by a customer over the past year does this simple linear regression model explain? c. Estimate the corresponding simple linear regression with the customers number of years of posthigh school education as the independent variable and credit card charges accrued by a customer over the past year as the dependent variable. Interpret the estimated relationship between the customers number of years of posthigh school education and credit card charges accrued over the past year. How much variation in credit card charges accrued by a customer over the past year does this simple linear regression model explain? d. Recall the multiple regression in Figure 4.23 with credit card charges accrued by a customer over the past year as the dependent variable and customers annual household income (x1), number of members of the household (x2), and number of years of posthigh school education (x3) as the independent variables. Do the estimated slopes differ substantially from the corresponding slopes that were estimated using simple linear regression in parts a, b, and c? What does this tell you about multicollinearity in the multiple regression model in Figure 4.23? e. Add the coefficients of determination for the simple linear regression in parts a, b, and c, and compare the result to the coefficient of determination for the multiple regression model in Figure 4.23. What does this tell you about multicollinearity in the multiple regression model in Figure 4.23? f. Add age, a dummy variable for gender, and a dummy variable for whether a customer has exceeded his or her credit limit in the past 12 months as independent variables to the multiple regression model in Figure 4.23. Code the dummy variable for gender as 1 if the customers gender is female and 0 if male, and code the dummy variable for whether a customer has exceeded his or her credit limit in the past 12 months as 1 if the customer has exceeded his or her credit limit in the past 12 months and 0 otherwise. Do these variables substantially improve the fit of your model?arrow_forwardUsing the following select financial statement information from Mover Supply Depot, compute the number of days sales in receivables ratios for 2018 and 2019 (round answers to two decimal places). What do the outcomes tell a potential investor about Mover Supply Depot if the competition collects in approximately 65 days?arrow_forwardConsider again the example introduced in Section 7.5 of a credit card company that has a database of information provided by its customers when they apply for credit cards. An analyst has created a multiple regression model for which the dependent variable in the model is credit card charges accrued by a customer in the data set over the past year (y), and the independent variables are the customers annual household income (x1), number of members of the household (x2), and number of years of post-high school education (x3). Figure 7.23 provides Excel output for a multiple regression model estimated using a data set the company created. a. Estimate the corresponding simple linear regression with the customers annual household income as the independent variable and credit card charges accrued by a customer over the past year as the dependent variable. Interpret the estimated relationship between the customers annual household income and credit card charges accrued over the past year. How much variation in credit card charges accrued by a customer over the past year is explained by this simple linear regression model? b. Estimate the corresponding simple linear regression with the number of members in the customers household as the independent variable and credit card charges accrued by a customer over the past year as the dependent variable. Interpret the estimated relationship between the number of members in the customers household and credit card charges accrued over the past year. How much variation in credit card charges accrued by a customer over the past year is explained by this simple linear regression model? c. Estimate the corresponding simple linear regression with the customers number of years of posthigh school education as the independent variable and credit card charges accrued by a customer over the past year as the dependent variable. Interpret the estimated relationship between the customers number of years of posthigh school education and credit card charges accrued over the past year. How much variation in credit card charges accrued by a customer over the past year is explained by this simple linear regression model? d. Recall the multiple regression in Figure 7.23 with credit card charges accrued by a customer over the past year as the dependent variable and customers annual household income (x1), number of members of the household (x2), and number of years of post-high school education (x3) as the independent variables. Do the estimated slopes differ substantially from the corresponding slopes that were estimated using simple linear regression in parts (a), (b), and (c)? What does this tell you about multicollinearity in the multiple regression model in Figure 7.23? e. Add the coefficients of determination for the simple linear regression in parts (a), (b), and (c), and compare the result to the coefficient of determination for the multiple regression model in Figure 7.23. What does this tell you about multicollinearity in the multiple regression model in Figure 7.23? f. Add age, a dummy variable for sex, and a dummy variable for whether a customer has exceeded his or her credit limit in the past 12 months as independent variables to the multiple regression model in Figure 7.23. Code the dummy variable for sex as 1 if the customer is female and 0 if male, and code the dummy variable for whether a customer has exceeded his or her credit limit in the past 12 months as 1 if the customer has exceeded his or her credit limit in the past 12 months and 0 otherwise. Do these variables substantially improve the fit of your model?arrow_forward
- The following select financial statement information from Candid Photography. Compute the accounts receivable turnover ratios and the number of days sales in receivables ratios for 2018 and 2019 (round answers to two decimal places). What do the outcomes tell a potential investor about Candid Photography if industry average for accounts receivable turnover ratio is 3 times and days sales in receivables ratio is 150 days?arrow_forwardExplain when EXACTLY you would prefer the previous balance method to the average daily balance including new purchase s method in determining your finance charge.arrow_forwardHow much purchases should be reported on the statement of comprehensive income for the year?arrow_forward
 Principles of Accounting Volume 1AccountingISBN:9781947172685Author:OpenStaxPublisher:OpenStax College
 Financial AccountingAccountingISBN:9781337272124Author:Carl Warren, James M. Reeve, Jonathan DuchacPublisher:Cengage Learning
 Managerial AccountingAccountingISBN:9781337912020Author:Carl Warren, Ph.d. Cma William B. TaylerPublisher:South-Western College Pub
 Essentials of Business Analytics (MindTap Course ...StatisticsISBN:9781305627734Author:Jeffrey D. Camm, James J. Cochran, Michael J. Fry, Jeffrey W. Ohlmann, David R. AndersonPublisher:Cengage Learning
 Essentials Of Business AnalyticsStatisticsISBN:9781285187273Author:Camm, Jeff.Publisher:Cengage Learning,