
Videos
Permeability of sandstone during weathering. Refer to the Geographical Analysis (Vol. 42, 201 0) study of the decay properties of sandstone when exposed to the weather, Exercise 2.47 (p. 72). Recall that slices of sandstone blocks were tested for permeability under three conditions: no exposure to any type of weathering (A), repeatedly sprayed with a 10% salt solution (B), and soaked in a 10% salt solution and dried (C). Measures of variation for the permeability measurements (mV) of each sandstone group are displayed in the accompanying Minitab printout.
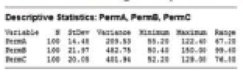
- a. Find the
range of the permeability measurements for Group A sandstone slices. Verify its value using the minimum and maximum values shown on the printout. - b. Find the standard deviation of the permeability measurements for Group A sandstone slices. Verify its value using the variance shown on the printout.
- c. Which condition (A, B, or C) has the more variable permeability data?
Want to see the full answer?
Check out a sample textbook solution
Chapter 2 Solutions
Statistics Plus New MyLab Statistics with Pearson eText -- Access Card Package (13th Edition)
Additional Math Textbook Solutions
Elementary Statistics Using Excel (6th Edition)
Elementary Statistics: Picturing the World (6th Edition)
Essential Statistics
Introduction to Statistical Quality Control
Elementary Statistics Using the TI-83/84 Plus Calculator, Books a la Carte Edition (4th Edition)
An Introduction to Mathematical Statistics and Its Applications (6th Edition)


- Here is a dataset containing plant growth measurements of plants grown in solutions of commonly-found chemicals in roadway runoff.Phragmites australis, a fast-growing non-native grass common to roadsides and disturbed wetlands of Tidewater Virginia, was grown in a greenhouse and watered with either: Distilled water (control); A weak petroleum solution (representing standard roadway runoff); Sodium chloride solution; Magnesium chloride solution; De-icing brine (50% sodium chloride and 50% magnesium chloride).Twenty grass preparations were used for each solution, and total growth (in cm) was recorded after watering every other day for 40 days.-Perform the correct statistical test to determine the p-value.-Report your answer rounded to four decimal places.-You should use formulas, functions, and the Data Analysis ToolPak in MS Excel to avoid additive rounding errors. Here are some useful functions: =t.test(array1,array2,tails,type) Produces a p-value for any…arrow_forwardAn urban community wants to show that the incidence of breast cancer is higher in their locality than in a neighboring rural area. (PCB levels were found to be higher in the soil of the urban community). If you find that in the urban community 20 out of 200 adult women have breast cancer and that in the rural community 10 out of 150 adult women have it, could you conclude, at a significance level of 0.05, that breast cancer is more prevalent in the urban community?1. The parameter of interest is:2. The hypotheses for this test are:3. The calculated test statistic is:4. The critical region is:5. Draw the critical region (make decision):6. It can be concluded that:arrow_forwardIn a detailed study of the productivity of a laboratory, the age distribution of its workers was analyzed, and the results were as follows, the kurtosis coefficient is equal toarrow_forward
- A deficiency of the trace element selenium in the diet can negatively impact growth, immunity, muscle and neuromuscular function, and fertility. The introduction of selenium supplements to dairy cows is justified when pastures have low selenium levels. Authors of the article “Effects of Short-Term Supplementation with Selenised Yeast on Milk Production and Composition of Lactating Cows” (Australian J. of Dairy Tech., 2004: 199–203) supplied the following data on milk selenium concentration (mg/L) for a sample of cows given a selenium supplement and a control sample given no supplement, both initially and after a 9-day period. Obs Init Se Init Cont Final Se Final Cont 1 11.4 9.1 138.3 9.3 2 9.6 8.7 104 8.8 3 10.1 9.7 96.4 8.8 4 8.5 10.8 89 10.1 5 10.3 10.9 88 9.6 6 10.6 10.6 103.8 8.6 7 11.8 10.1 147.3 10.4 8 9.8 12.3 97.1 12.4 9 10.9 8.8 172.6 9.3 10 10.3…arrow_forwardThe Turbine Oil Oxidation Test (TOST) and the Rotating Bomb Oxidation Test (RBOT) are two different procedures for evaluating the oxidation stability of steam turbine oils. An article reported the accompanying observations on x = TOST time (hr) and y = RBOT time (min) for 12 oil specimens. TOST 4200 3600 3750 3650 4050 2770 RBOT 370 345 375 315 350 205 TOST 4870 4525 3450 2700 3750 3325 RBOT 400 380 285 220 345 290 (a) Calculate the value of the sample correlation coefficient. (Round your answer to four decimal places.) r = Carry out a test of hypotheses to decide whether RBOT Time and TOST time are linearly related. (Use ? = 0.05.) Calculate the test statistic and determine the P-value. (Round your test statistic to two decimal places and your P-value to three decimal places.) t = P-value =arrow_forwardResearchers interested in lead exposure due to car exhaust sampled the blood of 52 police officers subjected to constant inhalation of automobile exhaust fumes while working traffic enforcement in a primarily urban environment. The blood samples of these officers had an average lead concentration of 124.32 µg/l and an SD of 37.74 µg/l; a previous study of individuals from a nearby suburb, with no history of exposure, found an average blood level concentration of 35 µg/l. Write down the hypotheses that would be appropriate for testing if the police officers appear to have been exposed to a higher concentration of lead. Explicitly state and check all conditions necessary for inference on these data. Test the hypothesis that the downtown police officers have a higher lead exposure than the group in the previous study. Interpret your results in context. Based on your preceding result, without performing a calculation, would a 99% confidence interval for the average blood concentration…arrow_forward
- Blood cocaine concentration (mg/L) was determinedboth for a sample of individuals who had died fromcocaine-induced excited delirium (ED) and for a sampleof those who had died from a cocaine overdose withoutexcited delirium; survival time for people in bothgroups was at most 6 hours. The accompanying datawas read from a comparative boxplot in the article“Fatal Excited Delirium Following Cocaine Use” (J.of Forensic Sciences, 1997: 25–31). ED 0 0 0 0 .1 .1 .1 .1 .2 .2 .3 .3.3 .4 .5 .7 .8 1.0 1.5 2.7 2.83.5 4.0 8.9 9.2 11.7 21.0Non-ED 0 0 0 0 0 .1 .1 .1 .1 .2 .2 .2.3 .3 .3 .4 .5 .5 .6 .8 .9 1.01.2 1.4 1.5 1.7 2.0 3.2 3.5 4.14.3 4.8 5.0 5.6 5.9 6.0 6.4 7.98.3 8.7 9.1 9.6 9.9 11.0 11.512.2 12.7 14.0 16.6 17.8 a. Determine the medians, fourths, and fourth spreadsfor the two samples.b. Are there any outliers in either sample? Any extremeoutliers?c. Construct a comparative boxplot, and use it as abasis for comparing and contrasting the ED andnon-ED samples.arrow_forwardSuppose a researcher is interested inthe effectiveness in a new childhood exercise program implemented in a SRS of schools across a particular county. In order to test the hypothesis that the new program decreases BMI (Kg/m2), the researcher takes a SRS of children from schools where the program is employed and a SRS from schools that do not employ the program and compares the results. Assume the following table represents the SRSs of students and their BMIs. Student intervention group BMI (kg/m2) Student control group BMI (kg/m2) A 18.6 A 21.6 B 18.2 B 18.9 C 19.5 C 19.4 D 18.9 D 22.6 E 24.1 F 23.6 A) Assuming that all the necessary conditions are met (normality, independence, etc.) carry out the appropriate statistical test to determine if the new exercise program is effective. Use an alpha level of 0.05. Do not assume equal variances.B) Construct a 95% confidence interval about your estimate for the average difference in BMI between the groups.arrow_forwardBiostatistics Outpatients (N = 36) with type 2 diabetes were referred back to the hospital because of the risk of developing chronic kidney disease (CKD) (possible kidney failure). During their follow-up, some patients were diagnosed with advanced (or end-stage) CKD, requiring an extension of their stay in the hospital, while others were readmitted for further medical assessment. Throughout the study, mortality and hospitalization rates, as well as bio-chemical lab test results, were reported. In addition, the attached data slice contains additional demographic data about the patient group. Q2: Write a statistical summary for patients’ health status that include Smoking status, Glucose level (mmol/L), C-reactive protein (CRP) (mg/L), Blood urea (mmol/L), Serum creatinine (μmol/L), and Albumin level (g/L).arrow_forward
- The article “Effect of Varying Solids Concentration and Organic Loading on the Performance of Temperature Phased Anaerobic Digestion Process” (S. Vandenburgh and T. Ellis, Water Environment Research, 2002:142–148) discusses experiments to determine the effect of the solids concentration on the performance of treatment methods for wastewater sludge. In the first experiment, the concentration of solids (in g/L) was 43.94 ± 1.18. In the second experiment, which was independent of the first, the concentration was 48.66 ± 1.76. Estimate the difference in the concentration between the two experiments, and find the uncertainty in the estimate.arrow_forwardA study was conducted to examine if children with autism spectrum disorder (ASD) had higher prenatal exposure to air pollution, specifically particulate matter < 2.5 g in diameter (PM2.5). Researchers obtained birth records of all children born in Los Angeles between 2000 and 2008 and linked these to the Department of Developmental Services records to determine if any of those subjects had been diagnosed with ASD or not. They used the birth addresses given in the birth records to determine the average daily PM2.5 for the third trimester for each child. The standard deviation for PM2.5 among ASD subjects was found to be 34.6 and for non-ASD subjects was 16.8. Assume PM2.5 is normally distributed. 4a. What was the study design? * Randomized Clinical Trial (RCT) * Case Report * Nested Case-Control Study * Case-Control Study * cross-sectional study Cohort Study 4B. What are the null and alternative hypotheses? 4c. What type of statistical test would you use to analyze the…arrow_forwardThe average drying time of a manufacturer’s paint is 20 minutes. Investigating the effectiveness of a modifica-tion in the chemical composition of her paint, the manu-facturer wants to test the null hypothesis μ = 20 minutes against a suitable alternative, where μ is the average dry-ing time of the modified paint. (a) What alternative hypothesis should the manufactureruse if she does not want to make the modification in thechemical composition of the paint unless it decreases thedrying time?(b) What alternative hypothesis should the manufactureruse if the new process is actually cheaper and she wants tomake the modification unless it increases the drying timeof the paint?arrow_forward
 Linear Algebra: A Modern IntroductionAlgebraISBN:9781285463247Author:David PoolePublisher:Cengage Learning
 Glencoe Algebra 1, Student Edition, 9780079039897...AlgebraISBN:9780079039897Author:CarterPublisher:McGraw Hill