Concept explainers
Videos
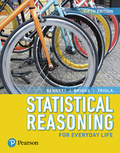
Housing Price Index. Realtors use an index to compare housing prices in major cities. The index numbers for several cities are given in the table below. In Exercises 25–32, use the following to find the price of a home in the given town.
30. Las Vegas and San Francisco. If a house is valued at $375,000 in San Francisco, find the price of a comparable house in Las Vegas.
Want to see the full answer?
Check out a sample textbook solution
Chapter 2 Solutions
EBK STATISTICAL REASONING FOR EVERYDAY


- Complete the following table: LU 6-2(3) 6–50. 6–51.arrow_forwardIn 2011, home prices and mortgage rates fell so far that in a number of cities the monthly cost of owning a home was less expensive than renting. The following data show the average asking rent and the monthly mortgage on the median-priced home (including taxes and insurance) for 10 cities where the average monthly mortgage payment was less than the average asking rent (The Wall Street Journal, November 26–27, 2011). 7. City Rent ($) Mortgage ($) Atlanta 840 539 1062 1002 Chicago Detroit 823 626 DATA file Jacksonville, Fla. Las Vegas 779 711 796 655 RentMortgage 1071 953 Miami 977 Minneapolis Orlando, Fla. 776 851 695 762 651 654 Phoenix St. Louis 723 Develop a scatter diagram for these data, treating the average asking rent as the inde- pendent variable. Does a simple linear regression model appear to be appropriate? b. Use a simple linear regression model to develop an estimated regression equation to predict the monthly mortgage on the median-priced home given the average asking…arrow_forwardJust simply answer the question.arrow_forward
- Classification of Data Identify the individuals and give the variables under the following: 1. You want to study about the people who climbed Mt. Everest. 2. The Department of Agriculture wishes to conduct a study about the pineapples in Tagaytay.arrow_forwardA company has experienced recent monthly sales of 100 (January), 150 (February), 140 (March), 130 (April), and 170 (May). Using a 3-month moving average, the projected sales value for June is closest to Group of answer choices. 138 147 300 230 (Ctr)- Styles Iarrow_forwardOn May 3, 1999, 59 tornadoes hit a certain state in the largest tornado outbreak ever recorded for that state. Sixteen of these were classified as strong (F2 or F3) or violent (F4 or F5). Answer parts a through c below. Length of Length of Length of Path (miles) Intensity Path (miles) Intensity Path (miles) Intensity F3 F3 F3 F2 F2 F3 F5 F2 F2 F3 45 5 9 4 37 6 13 0 I 8 6 15 40 1 20 45 NNIIN F2 F2 F4 F4 a. Make a box-and-whisker plot of the data for length of path. Choose the correct plot below. A. O B. O C. F2 F3 15 8 14 3 45arrow_forward
- Buyroooarrow_forwardUse the scatterplot of Vehicle Registrations below to answer the questions Vehicle Registrations in the United States, 1925- 2011 Vehicles millions 300 y = 3.0161x - 5819.5 R? = 0.9695 250 200 150 100 50 1960 1920 -50 1940 1980 2000 2020 Year How does the predicted number for 2005 compare to the actual value of 241 million? The predicted number is [Select] i than the actual value by [ Select] Registrations (in millions)arrow_forwardThe following table shows the number of hours a cleaning company spends cleaning apartments. Time (hours) 4. Apartments Cleaned 6. 9. 12arrow_forward
- D, E and F please, thank you!arrow_forwardDuring one shift, the express lane derk recorded how many times customers violated the "10 items or less" rule for his lane. In particular, he recorded how many items over the limit each violator placed on the conveyor belt. This data is summarized in the histogram below. NOTE: The last dass actually represents "7 or more items," not just 7 items. 14+ 12 10- 8. 0.5 15 2.5 3.5 4.5 5.5 6.5 7.5 # items over 10 What is the most frequent number of over-the-limit items for this data set? ans = What is the frequency of the most frequent number of over-the-limit items? ans = Enter an integer or mal number (mare. Question Help: Message instructor Submit Question Frequencyarrow_forwardThe bar chart below shows the speed (in gigaflops using a test package) of several processors. It is intended to be used to compare the overall speeds of the processors for consumers. Indicate features that would improve the representation of the data in the bar graph below. If there are no possible improvements, indicate so.arrow_forward
 Glencoe Algebra 1, Student Edition, 9780079039897...AlgebraISBN:9780079039897Author:CarterPublisher:McGraw Hill
 Holt Mcdougal Larson Pre-algebra: Student Edition...AlgebraISBN:9780547587776Author:HOLT MCDOUGALPublisher:HOLT MCDOUGAL
 Algebra & Trigonometry with Analytic GeometryAlgebraISBN:9781133382119Author:SwokowskiPublisher:Cengage