
Concept explainers
Videos
Housing Price Index. Realtors use an index to compare housing prices in major cities. The index numbers for several cities are given in the table below. In Exercises 25–32, use the following to find the price of a home in the given town.
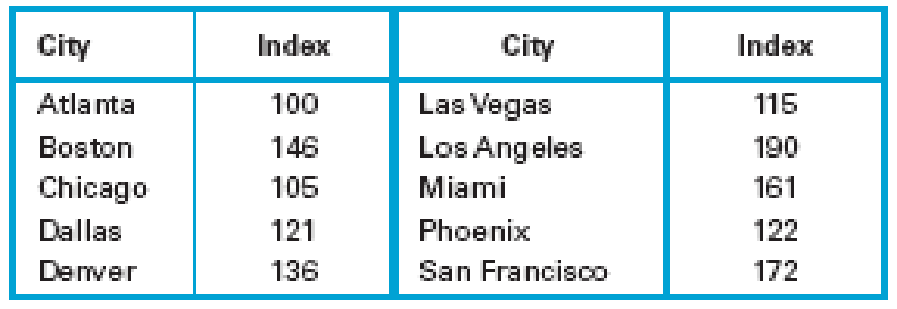
30. Las Vegas and San Francisco. If a house is valued at $375,000 in San Francisco, find the price of a comparable house in Las Vegas.
Want to see the full answer?
Check out a sample textbook solution
Chapter 2 Solutions
Statistical Reasoning for Everyday Life (5th Edition)


- Café Michigan's manager, Gary Stark, suspects that demand for mocha latte coffees depends on the price being charged. Based on historical observations, Gary has gathered the following data, which show the numbers of these coffees sold over six different price values: Price Number Sold $2.702.70 770770 $3.503.50 515515 $2.002.00 980980 $4.104.10 240240 $3.203.20 320320 $4.054.05 475475 Expain the steps for usingsimple linear regression and given that the price per cup is $1.75, the forecasted demand for mocha latte coffees will be how many cups?arrow_forwardThe table below gives some comparative data for two dates in February of 2021. Date World Cases World Deaths US cases US deaths OR cases OR deaths Feb 24, 2021 378745 8384 74128 3210 424 33 Feb 25, 2021 461058 11493 77803 2465 512 10 fill in blanks The number of cases in Oregon ( increased or decreased) by _____ cases. That is a ______% (increase or decrease).arrow_forwardThe table below gives some comparative data for two dates in February of 2021. Date World Cases World Deaths US cases US deaths OR cases OR deaths Feb 24, 2021 378745 8384 74128 3210 424 33 Feb 25, 2021 461058 11493 77803 2465 512 10 fill in the blank. The number of deaths in Oregon (increased or decreased) by _______ cases. That is a _____% ( increase or decrease)arrow_forward
- 8. The following table shows how high school students in four grade levels ate their lunch on a particular day – purchased in the cafeteria, brought a bag lunch, or purchased lunch off campus. What is the approximate proportion of Juniors that purchased lunch off-campus on this particular day? (A) 0.06 (B) 0.37 (C) 0.24 (D) 0.27 (E) 0.35arrow_forwardIn a study of exhaust emissions from school buses, the pollution intake by passengers was determined for a sample of nine school buses used in the Southern California Air Basin. The pollution intake is the amount of exhaust emissions, in grams per person, that would be inhaled while traveling on the bus during its usual 18-mile trip on congested freeways from South Central LA to a magnet school in West LA. Here are the amounts for the nine buses when driven with the windows open. 1.17 0.33 0.40 0.33 1.32 0.38 0.25 0.40 0.35 (a) Consider making a stemplot. Are there outliers or strong skewness that would preclude use of the t procedures? Which is correct? A. The sample is small and the stemplot is right skewed with possible outliers, so use of t procedures is not appropriate. b. The distribution is symmetric so use of t procedures is appropriate. c. The sample is small and the stemplot is left skewed with possible outliers, so use of t procedures is…arrow_forwardIn a study of exhaust emissions from school buses, the pollution intake by passengers was determined for a sample of nine school buses used in the Southern California Air Basin. The pollution intake is the amount of exhaust emissions, in grams per person, that would be inhaled while traveling on the bus during its usual 18-mile trip on congested freeways from South Central LA to a magnet school in West LA. Here are the amounts for the nine buses when driven with the windows open. 1.19 0.33 0.40 0.33 1.32 0.38 0.25 0.40 0.35 (a) Consider making a stemplot. Are there outliers or strong skewness that would preclude use of the t procedures? 1)The sample is small and the stemplot is right skewed with possible outliers, so use of t procedures is not appropriate. 2)The sample is small and the stemplot is left skewed with possible outliers, so use of t procedures is not appropriate. 3)The distribution has a slight right skew, but no potential outliers, so the…arrow_forward
- For a football game in the National Football League, let y = difference between the number of points scored by the home team and the away team (so y > 0 if the home team wins). Let x bet the predicted difference according to the Las Vegas betting spread. For the 768 NFL games played between 2003 and 2006, output follows. Predictor Coefficient SE Coef T P Constant -0.4022 0.5233 -0.77 0.442 BP 1.0251 0.0824 12.44 0.000 (a) We wish to test the null hypothesis that the Las Vegas predictions are unbiased. This will correspond with ? = 0 and ? = b) Based on the results shown in the table, is there much evidence that the sample fit differs from the model ?y = ? + ?x, with values of alpha and beta above? Why?arrow_forwardAlgbra The University of Technology and Applied Sciences offering three specialization programs Business Studies, Information Technology and Engineering. During the Academic Year 2020-2021, 600 students are selected Business studies, 200 students are selected Information Technology and 300 students are selected Engineering. Which one of the following ratios represents that the students selected Information Technology and Engineering? a. None of the options b. 3 : 2 c. 2 : 1 d. 2 : 3arrow_forwardThe table below gives adult wine consumption.arrow_forward
- You are given the following information about items X, Y, and Z. Unit Price $ Item 2010 2015 Annual Usage X 20 40 200 Y 80 120 400 Z 300 340 500 The weighted aggregate price index for 2015 is a. 120 b. 125 c. 121.505 d. 12.150arrow_forwardBaby Sofia is 6 months old. Her father takes her to her medical appointment at his neighbourhood family clinic. After Sofia is measured, her father is informed that she measures 68 cm, like 5 other babies who visit this clinic. In addition, he is told that 40 babies are bigger than her and that a total of 185 babies are being followed at the clinic. m What is Sofia's percentile rank at this clinic in relation to her height?arrow_forwardHow profitable are different sectors of the stock market? One way to answer such a question is to examine profit as a percentage of stockholder equity. A random sample of 32 retail stocks was studied for x1, profit as a percentage of stockholder equity. The result was x1 = 13.2. A random sample of 33 utility (gas and electric) stocks was studied for x2, profit as a percentage of stockholder equity. The result was x2 = 10.0. Assume ?1 = 4.2 and ?2 = 2.6. Note: For degrees of freedom d.f. not in the Student's t table, use the closest d.f. that is smaller. In some cases, this choice will increase the P-value by a small amount or increase the length of the confidence interval, thereby making the answer slightly more "conservative." (a) Let ?1 represent the population mean profit as a percentage of stockholder equity for retail stocks, and let ?2 represent the population mean profit as a percentage of stockholder equity for utility stocks. Find a 95% confidence interval for ?1 − ?2.…arrow_forward
 Holt Mcdougal Larson Pre-algebra: Student Edition...AlgebraISBN:9780547587776Author:HOLT MCDOUGALPublisher:HOLT MCDOUGAL
 Linear Algebra: A Modern IntroductionAlgebraISBN:9781285463247Author:David PoolePublisher:Cengage Learning
 Algebra & Trigonometry with Analytic GeometryAlgebraISBN:9781133382119Author:SwokowskiPublisher:Cengage