
Concept explainers
Videos
Housing Price Index. Realtors use an index to compare housing prices in major cities. The index numbers for several cities are given in the table below. In Exercises 25–32, use the following to find the price of a home in the given town.
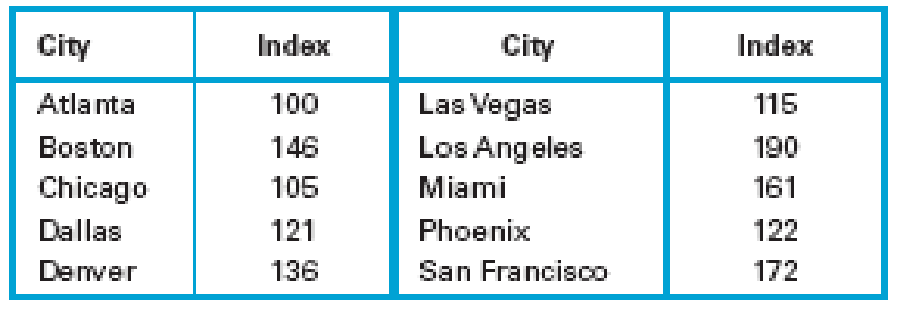
32. Denver and Dallas. If a house is valued at $835,000 in Dallas, find the price of a comparable house in Denver.
Want to see the full answer?
Check out a sample textbook solution
Chapter 2 Solutions
Pearson eText for Statistical Reasoning for Everyday Life -- Instant Access (Pearson+)


- In 2011, home prices and mortgage rates fell so far that in a number of cities the monthly cost of owning a home was less expensive than renting. The following data show the average asking rent and the monthly mortgage on the median-priced home (including taxes and insurance) for 10 cities where the average monthly mortgage payment was less than the average asking rent (The Wall Street Journal, November 26–27, 2011). 7. City Rent ($) Mortgage ($) Atlanta 840 539 1062 1002 Chicago Detroit 823 626 DATA file Jacksonville, Fla. Las Vegas 779 711 796 655 RentMortgage 1071 953 Miami 977 Minneapolis Orlando, Fla. 776 851 695 762 651 654 Phoenix St. Louis 723 Develop a scatter diagram for these data, treating the average asking rent as the inde- pendent variable. Does a simple linear regression model appear to be appropriate? b. Use a simple linear regression model to develop an estimated regression equation to predict the monthly mortgage on the median-priced home given the average asking…arrow_forwardThe boxplots below show the real estate values of single-family homes in two neighboring cities (in thousands of dollars). Statstown Medianville 0 20 40 60 80 100 120 140 Annual Income Which city has more households? A. Statstown B. O Medianville C. O Both cities have the same number of households. D. It is impossible to tell from the boxplots.arrow_forwardWhich model appears to be the best accordingly? A. Model I B. Model II C. Model III D. Model IVarrow_forward
- The table to the right gives the cost of living index (COLI) for six East Coast counties and six Midwest counties (using an index where 100 represents the average cost of living for all participating cities with a population of more than 1.5 million). Answer parts (a) through (e) below. East Coast Counties Midwest Counties A 104.1 U 96.4 B 128.3 V 92.7 C 314.5 W 94.2 D 134.9 X 87.5 E 123.8 Y 95.8 F 141.1 Z 228.3 The table to the right gives the cost of living index (COLI) for six East Coast counties and six Midwest counties (using an index where 100 represents the average cost of living for all participating cities with a population of more than 1.5 million). Answer parts (a) through (e) below. East Coast Counties Midwest Counties A 104.1 U 96.4 B 128.3 V 92.7 C 314.5 W 94.2 D 134.9 X 87.5 E 123.8 Y 95.8 F 141.1 Z…arrow_forwardClassification of Data Identify the individuals and give the variables under the following: 1. You want to study about the people who climbed Mt. Everest. 2. The Department of Agriculture wishes to conduct a study about the pineapples in Tagaytay.arrow_forwardThe table to the right gives the cost of living index (COLI) for six East Coast counties and six Midwest counties (using an index where 100 represents the average cost of living for all participating cities with a population of more than 1.5 million). Answer parts (a) through (e) below. East Coast Counties Midwest Counties A 104.5 U 96.3 B 128.4 V 92.5 C 314.2 W 94.3 D 134.2 X 87.5 E 123.2 Y 95.5 F 141.2 Z 228.4 a. Find the mean, median, and range for each of the two data sets. The mean for the East Coast Counties is . (Type an integer or decimal rounded to two decimal places asneeded.)arrow_forward
- Family Heights. In Exercises 1–5, use the following heights (in.) The data are matched so that each column consists of heights from the same family. Scatterplot Construct a scatterplot of the father/son heights, then interpret it.arrow_forwardThe boxplot below shows salaries for Construction workers and Teachers. Construction Teacher E 20 25 30 35 40 Salary (thousands of $) They are making more than Question Help: Video If a person is making the minimum salary for a construction worker, they are making more than what percentage of Teachers? Submit Question 45 50 Search + 55 % of Teachers. Enter an integer or decimal number [more..]arrow_forwardC. Describe the four characteristics of associationarrow_forward
- possible chemicals that may influence the health of the coral. They first look at how 1. The two-way table displays data about 55 different locations. Scientists have a lie nitrate concentration might be related to coral health. The table displays the hea of the coral (healthy or unhealthy) and nitrate concentration (low or high). low nitrate concentration high nitrate concentration total healthy 20 25 unhealthy 8 22 30 total 28 27 55 a. Complete the two-way relative frequency table for the data in the two-way table in which the relative frequencies are based on the total for each column. low nitrate concentration high nitrate concentration healthy unhealthy total 100% 100% b. When there is a low nitrate concentration, which had a higher relative frequency, healthy or unhealthy coral? c. When there is a high nitrate concentration, is there a higher relative frequency of healthy or unhealthy coral?arrow_forwardInterpret the table following the suggested guidlines.arrow_forwardDuring one shift, the express lane clerk recorded how many times customers violated the "10 items or less" rule for his lane. In particular, he recorded how many items over the limit each violator placed on the conveyor belt. This data is summarized in the histogram below. NOTE: The last class actually represents "7 or more items," not just 7 items. 14+ 12 10- 8- 6- 4 0.5 1.5 2.5 3.5 4.5 5.5 6.5 7.5 # items over 10 What is the most frequent number of over-the-limit items for this data set? ans = What is the frequency of the most frequent number of over-the-limit items? ans = Frequency 2.arrow_forward
 Glencoe Algebra 1, Student Edition, 9780079039897...AlgebraISBN:9780079039897Author:CarterPublisher:McGraw Hill