
Modern Business Statistics with Microsoft Excel (MindTap Course List)
5th Edition
ISBN: 9781285433301
Author: David R. Anderson, Dennis J. Sweeney, Thomas A. Williams
Publisher: Cengage Learning
expand_more
expand_more
format_list_bulleted
Concept explainers
Videos
Textbook Question
Chapter 2.4, Problem 36E
The following 20 observations are for two quantitative variables, x and y.
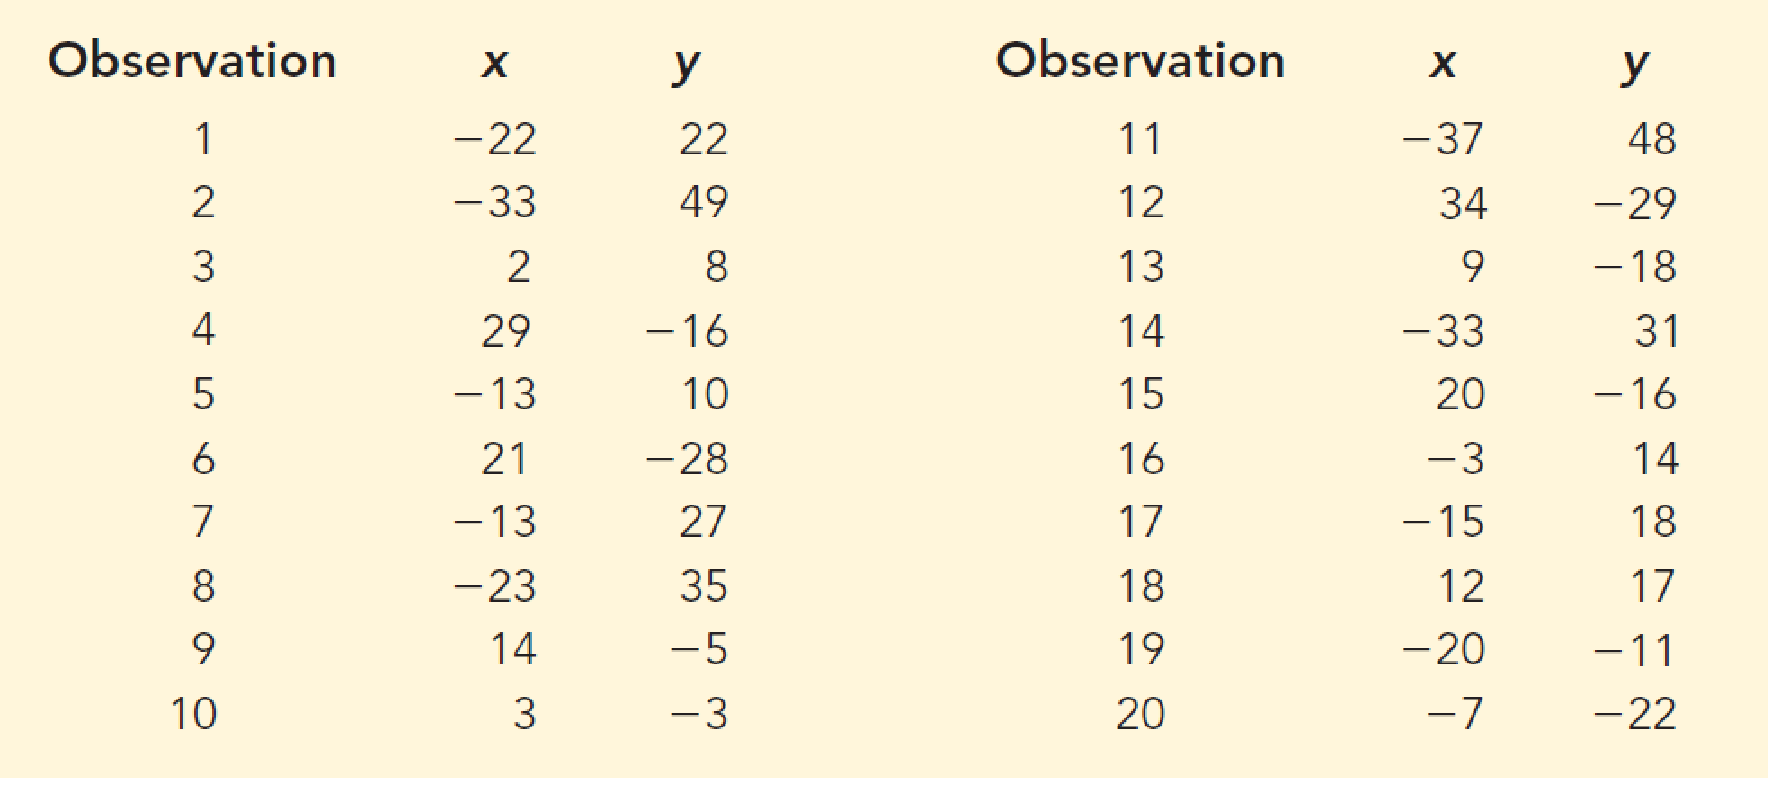
- a. Develop a
scatter diagram for the relationship between x and y. - b. What is the relationship, if any, between x and y?
Expert Solution & Answer
Want to see the full answer?
Check out a sample textbook solution
Chapter 2 Solutions
Modern Business Statistics with Microsoft Excel (MindTap Course List)
Ch. 2.1 - Methods
1. The response to a question has three...Ch. 2.1 - 2. A partial relative frequency distribution is...Ch. 2.1 - A questionnaire provides 58 Yes, 42 No, and 20...Ch. 2.1 -
For the 2010–2011 viewing season, the top five...Ch. 2.1 -
In alphabetical order, the six most common last...Ch. 2.1 - Top Rated Television Show Networks. Nielsen Media...Ch. 2.1 - Airline Customer Satisfaction Survey. Many...Ch. 2.1 - Prob. 8ECh. 2.1 - Prob. 9ECh. 2.1 -
VirtualTourist provides ratings for hotels...
Ch. 2.2 - 11. Consider the following data.
Develop a...Ch. 2.2 - 12. Consider the following frequency...Ch. 2.2 - Construct a histogram for the data in exercise...Ch. 2.2 - Prob. 14ECh. 2.2 - Construct a stem-and-leaf display for the...Ch. 2.2 - Construct a stem-and-leaf display for the...Ch. 2.2 - Applications
17. A doctor’s office staff studied...Ch. 2.2 - NBA Total Player Ratings. CBSSports.com developed...Ch. 2.2 - CEO Time in Meetings. The London School of...Ch. 2.2 - Prob. 21ECh. 2.2 - Top U.S. Franchises. Entrepreneur magazine ranks...Ch. 2.2 - Prob. 23ECh. 2.2 - Prob. 24ECh. 2.2 - Prob. 25ECh. 2.2 - Prob. 26ECh. 2.3 - The following data are for 30 observations...Ch. 2.3 - The following observations are for two...Ch. 2.3 - Prob. 29ECh. 2.3 - Refer again to the crosstabulation of household...Ch. 2.3 - 31. Recently, management at Oak Tree Golf Course...Ch. 2.3 -
Table 2.12 shows a data set containing...Ch. 2.3 - Prob. 33ECh. 2.3 - Prob. 34ECh. 2.3 -
The U.S. Department of Energy's Fuel Economy...Ch. 2.4 - The following 20 observations are for two...Ch. 2.4 - Prob. 37ECh. 2.4 - The following crosstabulation summarizes the data...Ch. 2.4 - Driving Speed and Fuel Efficiency. A study on...Ch. 2.4 - Prob. 40ECh. 2.4 - Hypertension and Heart Disease. People often wait...Ch. 2.4 -
Smartphones are mobile phones with Internet,...Ch. 2.4 - Store Managers Time Study. The Northwest regional...Ch. 2 - SAT Scores. The SAT is a standardized test used by...Ch. 2 - Prob. 45SECh. 2 - State Populations. Data showing the population by...Ch. 2 - Startup Company Funds. According to the Wall...Ch. 2 - Complaints Reported to BBB. Consumer complaints...Ch. 2 - Prob. 49SECh. 2 - Prob. 50SECh. 2 - Prob. 51SECh. 2 - Best Places to Work. Fortune magazine publishes an...Ch. 2 - Prob. 53SECh. 2 - Prob. 54SECh. 2 - Prob. 55SECh. 2 - Prob. 56SECh. 2 -
Google has changed its strategy with regard to...Ch. 2 -
A zoo has categorized its visitors into three...Ch. 2 - Pelican Stores, a division of National Clothing,...Ch. 2 -
Motion Picture Industry
The motion picture...
Knowledge Booster


Learn more about
Need a deep-dive on the concept behind this application? Look no further. Learn more about this topic, statistics and related others by exploring similar questions and additional content below.Similar questions
Recommended textbooks for you
 Glencoe Algebra 1, Student Edition, 9780079039897...AlgebraISBN:9780079039897Author:CarterPublisher:McGraw Hill
 Functions and Change: A Modeling Approach to Coll...AlgebraISBN:9781337111348Author:Bruce Crauder, Benny Evans, Alan NoellPublisher:Cengage Learning
Glencoe Algebra 1, Student Edition, 9780079039897...
Algebra
ISBN:9780079039897
Author:Carter
Publisher:McGraw Hill
Functions and Change: A Modeling Approach to Coll...
Algebra
ISBN:9781337111348
Author:Bruce Crauder, Benny Evans, Alan Noell
Publisher:Cengage Learning
Correlation Vs Regression: Difference Between them with definition & Comparison Chart; Author: Key Differences;https://www.youtube.com/watch?v=Ou2QGSJVd0U;License: Standard YouTube License, CC-BY
Correlation and Regression: Concepts with Illustrative examples; Author: LEARN & APPLY : Lean and Six Sigma;https://www.youtube.com/watch?v=xTpHD5WLuoA;License: Standard YouTube License, CC-BY