
Biological Science
5th Edition
ISBN: 9780321743671
Author: Scott Freeman
Publisher: PEARSON
expand_more
expand_more
format_list_bulleted
Concept explainers
Question
Chapter 25, Problem 10TYU
Summary Introduction
To analyze:
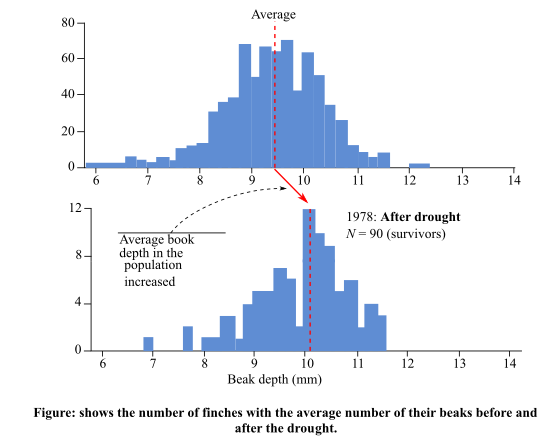
The reason behind the increase in the average number of finches with deeper beak size after the drought by calculating the percentage of finches that survived, when there were more finches that had a deep beak before the drought.
Introduction:
Natural selection is an evolutionary mechanism, by which the organisms that are better adapted to their environment survive and attain reproductive success. The concept of natural selection was given by Charles Darwin, who was a naturalist, biologist, and a geologist from England. His concept of natural selection explains the diversity of life on the Earth.
The graph below shows the number of finches in response to the drought and the average depth of their beaks.
Expert Solution & Answer
Want to see the full answer?
Check out a sample textbook solution
Students have asked these similar questions
Which is the Dependent Variable and the independent variable in the below question.
The beak length and depth for medium ground finches recorded over 5 years?
Briefly interpret the graphs about Comparisons of prey toxicity and predator resistance from two localities?
Are feral cats bigger then average domestic cats could they grow to main coon size or even bobcat size?
Chapter 25 Solutions
Biological Science
Ch. 25 - True or false? Some trails are considered...Ch. 25 - CAUTION Why does the presence of extinct forms and...Ch. 25 - 3. Trails that are derived from a common ancestor,...Ch. 25 - How can biological fitness be estimated? a....Ch. 25 - 5. CAUTION According to data presented in this...Ch. 25 - Some biologists summarize evolution by natural...Ch. 25 - Prob. 9TYUCh. 25 - 9. The average height of humans in industrialized...Ch. 25 - Prob. 16TYPSSCh. 25 - Prob. 3TYK
Knowledge Booster


Learn more about
Need a deep-dive on the concept behind this application? Look no further. Learn more about this topic, biology and related others by exploring similar questions and additional content below.Similar questions
- Two predators feed on small antelope. One predator weighs 100 kg, and the other weighs 35 kg. Explain what might happen if the two predators share the same area. Give an explained answer.arrow_forwardWhich describes the most likely result that the scientists found when they compared the average beak size in the years before 1977 with the average beak size in the years after 1977 ? A. Average beak size after the drought could not be measured for comparison B. Average beak size after the drought was larger than before the drought C. Average beak size after the drought was smaller than before the drought D. Average beak size after the drought was the same as before the droughtarrow_forwardState the results of the analysis of the distance effect in South Pacific bird species.arrow_forward
- How did predation affect the number of starving deer in Yellowstone? Use the data from Data Table 1 in the image and the vocabulary terms prey, predator, predation, balance, ecosystem, overpopulation, and vegetation in your response.arrow_forwardGiven your knowledge of how predators and resources can affect life history traits, hypothesize how the four combinations of high resources, low resources, predator presence, and predator absence would affect the size at maturity of a prey species.arrow_forwardInterpret the following graphs: In the graphs, the number of days are 18.. 1 day is equal to 60 sec. For the first graph, days are taken on x-axis. The mean foraging times are taken on y-axis. For the 2nd graph, percentage of prey caught during first half of winter(1-6days) were taken on x-axis and percentage of prey caught during 2nd half of winter(7-12days) were taken on y-axis.arrow_forward
- Uta stansburiana is a territorial species. Given that, which pattern of spatial dispersion would you expect? Random Clumped Uniform Can't tell from this one fact about the lizardarrow_forwardGreat white sharks prefer marine mammals like seals but can eat a number of other prey items, including birds and fish. According to the table below, what is the critical search time for seals, above which great white sharks should choose to eat an albatross if they encounter one? Prey item: seal (energy = 60 Mcals, handling time = 5 minutes) Prey item: albatross (energy = 10 Mcals, handling time = 2 minutes)arrow_forwardDiscuss the pros and cons,in energetic terms,of (i) being a generalist as opposed to a specialist predator, and (ii) being a sit–and –wait predator as opposed to an active forager?arrow_forward
- Give typing answer with explanation and conclusion A conservationist wants to enhance survival of individual Daphnia populations in the metapopulation along the Scandinavian coast. To be successful, which action would this conservationist most likely carry out in these freshwater rock pools? a. Connecting vulnerable pools by making dispersal corridors to the ocean b.Separating the smallest pools from the largest to prevent immigration c.Removing the shortest-lived Daphnia species from all pools d.Separating pools so the Daphnia cannot mix with one another e.Connecting vulnerable pools by making dispersal corridors between themarrow_forwardUse Verbal description of results from graph and then Interpret the graph for Foraging in Mixed Species Flocks sccenario in foraging lab. The interpretations must include Were the results expected and Did they support the hypotheses? If so, state the biological significance of the results from graph. If the results deviated significantly from expected results, discuss the hypotheses onthe basis of expected results and include an explanation of why this might be so. Lastly, state the conclusions drawn from the experiment and their biological relevance. Hypothesis: the assumption underscores the enhancement of foraging efficiency associated with the establishment of mixed-species flocks, emphasizing the advantages of cooperation and safety in numbers.arrow_forwardDo the following two hypothesis supports their graphs? Explain. Figure 1: The hypothesis for novice vs. experienced foraging is that animals who have been foraging for ages should have a greater chance of survival than beginner foragers since they are more skilled and invest less time looking for food. Figure 2: The hypothesis behind the impact of Prey camouflage is that if animals, especially novice foragers, take too much time searching, they are visible to predators for long durations, providing a better chance to attack.arrow_forward
arrow_back_ios
SEE MORE QUESTIONS
arrow_forward_ios
Recommended textbooks for you
 Biology (MindTap Course List)BiologyISBN:9781337392938Author:Eldra Solomon, Charles Martin, Diana W. Martin, Linda R. BergPublisher:Cengage Learning
Biology (MindTap Course List)
Biology
ISBN:9781337392938
Author:Eldra Solomon, Charles Martin, Diana W. Martin, Linda R. Berg
Publisher:Cengage Learning