
Videos
The function
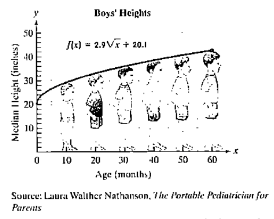
a. Describe how the graph can be obtained using transformations of the square root function
b. According to the model, what is the median height of boys who are 48 months, or four years, old? Use a calculator and round to the nearest tenth of an inch. The actual median height for boys at 48 months is 40.8 inches. How well does the model describe the actual height?
c. Use the model to find the average rate of change, in inches per month, between birth and 10 months. Round
to the nearest tenth.
d. Use the model to find the average rate of change, in inches per month, between 50 and 60 months. Round to the nearest tenth. How does this compare with your answer in part (c)? How is this difference shown by the graph?
Want to see the full answer?
Check out a sample textbook solution
Chapter 2 Solutions
College Algebra


- Draw a sketch of the square and cube functions. What are the similarities and differences in the graphs?arrow_forwardWrite the quadratic function in f(x)=a(xh)2+k form whose graph is shown.arrow_forwardWhen examining the formula of a function that is the result of multiple transformations, how can you tell a horizontal shift from a vertical shift?arrow_forward
 Trigonometry (MindTap Course List)TrigonometryISBN:9781337278461Author:Ron LarsonPublisher:Cengage Learning
 Glencoe Algebra 1, Student Edition, 9780079039897...AlgebraISBN:9780079039897Author:CarterPublisher:McGraw Hill
 Algebra & Trigonometry with Analytic GeometryAlgebraISBN:9781133382119Author:SwokowskiPublisher:Cengage
