
Pearson eText Human Physiology: An Integrated Approach -- Instant Access (Pearson+)
8th Edition
ISBN: 9780135212905
Author: Dee Silverthorn
Publisher: PEARSON+
expand_more
expand_more
format_list_bulleted
Videos
Textbook Question
Chapter 25, Problem 21RQ
The following graph shows left ventricular pressure-volume curves in one individual. Curve A is the person sitting at rest. Curve B shows the person’s cardiac response to mild exercise on a stationary bicycle. Curve C shows the cardiac response during maximum intensity cycling.
- a. Calculate the stroke volume for each of the curves.
- b. Given the following cardiac outputs (CO), calculate the heart rates for each condition.
COA = 6 L/min, COB = 10.5 L/min, COC = 19 L/min
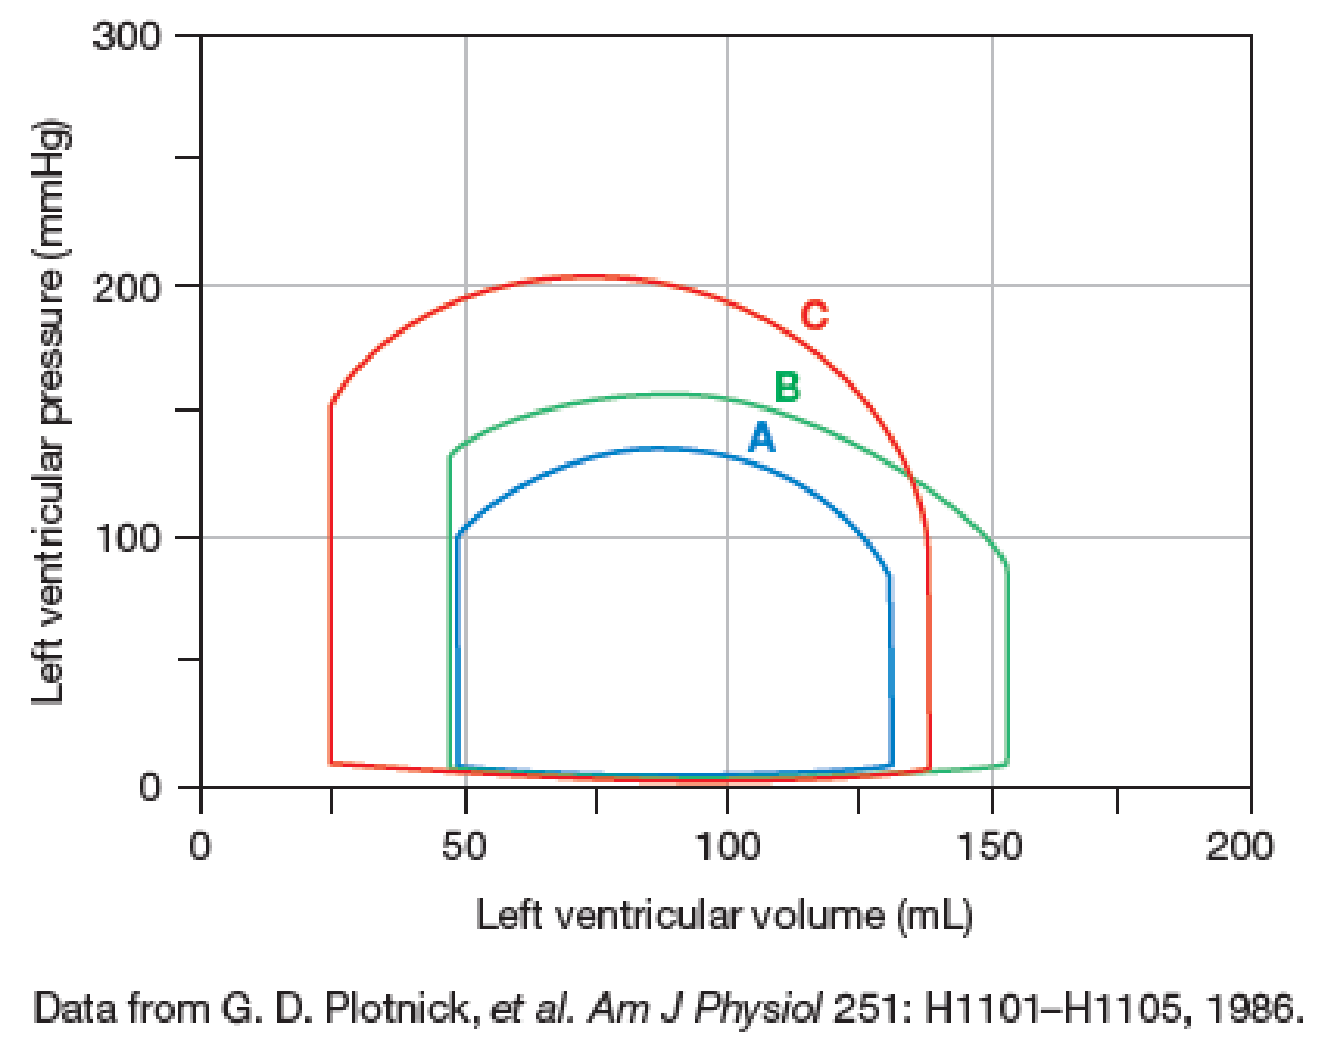
- c. Which exercise curve shows an increase in stroke volume due primarily to increased contractility? Which exercise curve shows an increase in stroke volume due primarily to increased venous return?
- d. Mechanistically, why did the end-diastolic volume in curve C fall back toward the resting value?
Expert Solution & Answer
Want to see the full answer?
Check out a sample textbook solution
Students have asked these similar questions
Assume that one ventricle of a child’s heart has an EDV of 90 mL, an ESV of 60 mL, and a cardiac output of 2.55 L/min. What are the child’s stroke volume (SV), ejection fraction (EF), and heart rate (HR)?a. SV = 60 mL; EF = 33%; HR = 85 bpmb. SV = 30 mL; EF = 60%; HR = 75 bpmc. SV = 150 mL; EF = 67%; HR = 42 bpmd. SV = 30 mL; EF = 33%; HR = 85 bpme. Not enough information is given to calculate these.
The end systolic volume from an individual’s heart was found to be 50 ml, the end diastolic volume was found to be 110 ml and the heart rate was 90 bpm. What is this individual’s stroke volume, ejection fraction and cardiac output (C.O)?
Group of answer choices
SV = 60 ml Ejection Fraction = 50% C.O = 3.4 l/min
SV = 110 ml Ejection Fraction = 52% C.O = 4.4 l/min
SV = 60 ml Ejection Fraction = 55% C.O = 5.4 l/min
SV = 160 ml Ejection Fraction = 70 % C.O = 6.4 l/min
In resting state: For a heart that would have a left ventricle of 130 mL of end diastolic volume (EDV) and 60 mL of end systolic volume (ESV) and a heart rate 60 bpm.
A. Calculate the output your pump should provide to the aortic arch. (in units of L/min)
B. In moderate activity state: If the heart rate is expected to increase by 15% Calculate the output your pump should provide to the aortic arch hibernation levels so they can
go back to sleep. A mitochondria-rich tissue called "brown fat" is responsible for this heat-generation.
Chapter 25 Solutions
Pearson eText Human Physiology: An Integrated Approach -- Instant Access (Pearson+)
Ch. 25.2 - If venous PO2 decreases as exercise intensity...Ch. 25.3 - In Figure 25.8b, why does the line for mean blood...Ch. 25.5 - The active vasodilator nerves to the skin secrete...Ch. 25 - Name the two muscle compounds that store energy in...Ch. 25 - Prob. 2RQCh. 25 - Prob. 3RQCh. 25 - Prob. 4RQCh. 25 - Prob. 5RQCh. 25 - What is meant by the term oxygen deficit, and how...Ch. 25 - Prob. 7RQ
Ch. 25 - In endurance events, body temperature can reach...Ch. 25 - Prob. 9RQCh. 25 - Prob. 10RQCh. 25 - Prob. 11RQCh. 25 - Prob. 12RQCh. 25 - Match the following brain areas with the...Ch. 25 - Specify whether each of the following parameters...Ch. 25 - Why doesnt increased venous return during exercise...Ch. 25 - Diagram the three theories that explain why the...Ch. 25 - Prob. 17RQCh. 25 - Explain how exercise decreases blood glucose in...Ch. 25 - Prob. 19RQCh. 25 - Prob. 20RQCh. 25 - The following graph shows left ventricular...
Knowledge Booster


Learn more about
Need a deep-dive on the concept behind this application? Look no further. Learn more about this topic, biology and related others by exploring similar questions and additional content below.Similar questions
- A 43-year-old woman has congestive heart failure after a myocardial infarction. Before the myocardial infarction, she had a cardiac output of 5 L/min and a right atrial pressure of 0 mm Hg at rest. The solid curve in the graph shows the relationship between right atrial pressure and cardiac output in a normal heart. Which of the following lettered points best represents the change in this relationship after the development of congestive heart failure?arrow_forwardA 50-year-old man has a body weight of 110Kg, resting heart rate is 90bpm, arterial pressure is 120/70mm hematocrit is 35% and body temperature is normal. His pressure-volume diagram of the left ventricle is shown below.What is his resting cardiac output in ml/minute?arrow_forwardMake a list of the different physiological equations: Cardiac Output (Q) = Fick Equation for VO2 = Pulse Pressure (PP) =arrow_forward
- There are three major factors that affect stroke volume and therefore affect cardiac output: afterload, preload, and contractility. Explain how and why each of these factors affects cardiac output. Each answer must explain what the factor is as well as how it affects cardiac output.arrow_forwardAfterload is Select one: a. the amount cardiac output must increase during exercise. b. the arterial pressure that the ventricles must overcome to eject blood. c. the extent to which ventricular walls are stretched. d. the name given to an increase in end-diastolic volume. e. another name for venous return.arrow_forwardIn a healthy heart during exercise, cardiac output increases as heart rate increases up to about 120bpm, as stroke volume remains constant (CO = HR x SV). As heart rate goes further up, the cardiac output remains stable, and above 160bm it decreases. Why does it decrease? A. shorter filling time decreases stroke volume B. venous return decreases C. valves cannot open and close fast enough D. contractile power of heart muscle cells increasesarrow_forward
- 2) It was stated that the cardiac cycle is 0,8 s, the phase of isometric contraction — 0,08 s, and the ejection period - 0,33 s. Estimate values of these parameters. In what cases can it change in such a way?arrow_forwardSue goes to the gym and after an initial warm-up, she increases her exercise level pushing herself to maximum. At this point her heart rate is 175 beats/min and her stroke volume is 135 ml/beat. What is her cardiac output now? At this point, by how many ml/min has her CO increased over her resting CO? What % increase over resting is this? (Use the following equation). amount of increase in CO in ml/min % increase = _____________ X 100% original CO (resting) ml/min What term is used to describe this increase in CO?arrow_forwardConsider a person standing up from a supine position. How do each of the following parameters change in the first seconds after standing compared to what they were at rest, before they return to normal set point? Total Peripheral Resistance (TPR) Venous Return End Diastolic Volume (EDV) Stroke Volume Heart Rate Mean Arterial Pressure (MAP) [Choose ] ✓ [Choose ] No change Decrease Increase [Choose ] [Choose ] [Choose ]arrow_forward
- All of the following are correct about the isovolumetric contraction, except ____________. A. This phase of the cardiac cycle begins with the appearance of the QRS complex of the ECG, which represents atrial repolarization and ventricular depolarization B. It represents the time period between the closure of the AV valves and the opening of the aortic and pulmonic valves, ventricular pressure rises rapidly without a change in ventricular volume C. The rate of pressure increase in the ventricles is determined by the rate of contraction of the muscle fibers, which is determine by mechanisms governing excitation-contraction coupling D. Ventricular chamber geometry changes considerably as the heart becomes more spheroid in shape; circumference increases and atrial base-to-apex length increasesarrow_forwardThe cardiac output of 70-year-old man at rest is 5.5L / min; mean HR is 85 bpm. Left ventricular end-diastolic volume (LVEDV) is estimated to average 85 ml. What is the mean ejection fraction?arrow_forwardDiscuss how the Frank-Starling law of the heart helps to explain the influence of venous return on stroke volume.arrow_forward
arrow_back_ios
SEE MORE QUESTIONS
arrow_forward_ios
Recommended textbooks for you
 Human Physiology: From Cells to Systems (MindTap ...BiologyISBN:9781285866932Author:Lauralee SherwoodPublisher:Cengage Learning
 Basic Clinical Lab Competencies for Respiratory C...NursingISBN:9781285244662Author:WhitePublisher:Cengage
- Essentials of Pharmacology for Health ProfessionsNursingISBN:9781305441620Author:WOODROWPublisher:Cengage
 Medical Terminology for Health Professions, Spira...Health & NutritionISBN:9781305634350Author:Ann Ehrlich, Carol L. Schroeder, Laura Ehrlich, Katrina A. SchroederPublisher:Cengage Learning
 Comprehensive Medical Assisting: Administrative a...NursingISBN:9781305964792Author:Wilburta Q. Lindh, Carol D. Tamparo, Barbara M. Dahl, Julie Morris, Cindy CorreaPublisher:Cengage Learning
Human Physiology: From Cells to Systems (MindTap ...
Biology
ISBN:9781285866932
Author:Lauralee Sherwood
Publisher:Cengage Learning
Basic Clinical Lab Competencies for Respiratory C...
Nursing
ISBN:9781285244662
Author:White
Publisher:Cengage
Essentials of Pharmacology for Health Professions
Nursing
ISBN:9781305441620
Author:WOODROW
Publisher:Cengage
Medical Terminology for Health Professions, Spira...
Health & Nutrition
ISBN:9781305634350
Author:Ann Ehrlich, Carol L. Schroeder, Laura Ehrlich, Katrina A. Schroeder
Publisher:Cengage Learning
Comprehensive Medical Assisting: Administrative a...
Nursing
ISBN:9781305964792
Author:Wilburta Q. Lindh, Carol D. Tamparo, Barbara M. Dahl, Julie Morris, Cindy Correa
Publisher:Cengage Learning
The Cardiovascular System: An Overview; Author: Strong Medicine;https://www.youtube.com/watch?v=Wu18mpI_62s;License: Standard youtube license