Concept explainers
Videos
Five cards are selected at random without replacement from a standard, thoroughly shuffled 52-card deck of playing cards. Let X equal the number of face cards (kings, queens. jacks) in the hand. Forty observations of X yielded the following data:
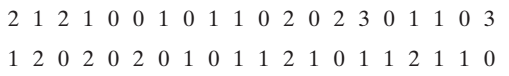
(a) Argue that the pmf of X is
(b) Draw a probability histogram for this distribution.
(c) Determine the relative frequencies of 0. 1, 2. 3, and superimpose the relative frequency histogram on your probability histogram.
Want to see the full answer?
Check out a sample textbook solution
Chapter 2 Solutions
Probability And Statistical Inference (10th Edition)


- A random sample of 80 poultry farms of one variety gave an average production of 240 eggs per bird. Another random sample of 50 poultry farms of another variety gave an average production of 195 eggs per bird. At a=0.05 is there sufficient evidence to support that there is a significant difference between the egg production of the two varieties of birds. Assume o1 =18 eggs and o2=15 eggsarrow_forwardA researcher examined number of monthly meetings (2 or 4) on job satisfaction. If the t obtained for a correlated groups t-test was 2.50, df = 3, and the t critical = 2.353, what should s/he conclude?arrow_forwardSuppose that the 101 randomly selected eighth-grade students (mentioned in question 6) took a “practice” test similar to the official standardized test a month before the official test was administered. The researchers reported that the (two-tailed) statistical test of the difference between the practice and official test scores resulted in t100 = -2.32, p < .05. (a) Given that the difference score was computed as D = (practice score – official score), do the reported results indicate that students scored significantly higher or lower on the official test relative to the practice test? Explain. (b) If we constructed the corresponding 95% confidence interval for the mean difference (between the practice and official test scores) in the population, would it include zero? Explain.arrow_forward
- Pet Owners A study of pet owners showed the following information concerning the ownership of the dogs and cats. At =α0.10 , is there a relationship between the number of people in a family and dog or cat ownership? Use the critical value method with tables. 1 person 2 people 3 people 4 or more people Dog 5 15 10 25 Cat 10 15 15 15 1)State the hypotheses and identify the claim. H0: Pet ownership is ▼(DEPENDANT ON or INDEPENDANT OF?) the number of people living in the household. (CLAIM OR NOT CLAIM?) H1 : Pet ownership is (DEPENDANT ON or INDEPENDANT OF?) the number of people living in the household. (CLAIM OR NOT CLAIM?) 2. Find the critical value 3. Compute the test value: X^2= 4. Reject or Do not reject the null hypothesis 5. Summarize: Is there or is there not enough evidence to reject the claim?Is there or is there not enough evidence to support the claim?arrow_forwardLet X1, . . . , Xn, . . . ∼ iid Bern(θ). Consider the Bayes estimator under squared error loss with the Unif(0,1) prior. Show that this estimator is consistent.arrow_forwardLet X1, . . . , Xn ∼ iid Unif(θ1, θ2), where both θ1 and θ2 are unknown. Find the MOM estimator and compare them to the MLE.arrow_forward
- Persons having Raynaud's syndrome are apt to suffer a sudden impairment of blood circulation in fingers and toes. In an experiment to study the extent of this impairment, each subject immersed a forefinger in water and the resulting heat output (cal/cm2/min) was measured. For m = 9 subjects with the syndrome, the average heat output was x = 0.61, and for n = 9 nonsufferers, the average output was 2.09. Let ?1 and ?2 denote the true average heat outputs for the sufferers and nonsufferers, respectively. Assume that the two distributions of heat output are normal with ?1 = 0.3 and ?2 = 0.5. (a) Consider testing H0: ?1 − ?2 = −1.0 versus Ha: ?1 − ?2 < −1.0 at level 0.01. Describe in words what Ha says, and then carry out the test. Ha says that the average heat output for sufferers is the same as that of non-sufferers.Ha says that the average heat output for sufferers is less than 1 cal/cm2/min below that of non-sufferers. Ha says that the average heat output for sufferers is more…arrow_forwardA researcher wants to examine the relationship between time spend on social media (variable X) and loneliness (variable Y) in young adults. A randomly sample of n = 52 young adults was asked how much time in average they spend on social media each day and how lonely day feel on a typical day. The partial computations of collected data produced the following results: SP = -14 MX = 10 SSx = 36 MY = 16 SSY = 49 A. Based on these results, is there a significant correlation between time spend on social media and loneliness among young adults? Use a Pearson correlation test with p < .05, 2-tails to answer this research question. Follow the steps of hypothesis testing and insert your answers below. In your calculations,round all numbers to two decimal places to avoid rounding errors. ANSWER H0: H1: Computed Pearson r = df for decision about H0: Critical r-value used for decision about H0: Decision about H0 (i.e., reject or fail to…arrow_forwardA survey among the workers in a large manufacturing company was taken, in order to findout from which company the workers had purchased their mobile phones, and to find outwhether the choice of mobile phone company was related to the type of worker. The resultsare shown in the table below. ls there evidence, at 5% level, that the choice of Phone Company is independent of the type ofworker?arrow_forward
- Persons having Raynaud's syndrome are apt to suffer a sudden impairment of blood circulation in fingers and toes. In an experiment to study the extent of this impairment, each subject immersed a forefinger in water and the resulting heat output (cal/cm2/min) was measured. For m = 9 subjects with the syndrome, the average heat output was x = 0.65, and for n = 9 nonsufferers, the average output was 2.03. Let μ1 and μ2 denote the true average heat outputs for the sufferers and nonsufferers, respectively. Assume that the two distributions of heat output are normal witarrow_forwardMarine biologists have noticed that the color of the outermost growth band on a clam tends to be related to the time of year in which the clam dies. A biologist conducted a small investigation of whether this is true for the species Protothaca staminea. She collected a sample of 50 clam shells in February and 27 clam shells in March. 15 of the shells from February had a dark color on the outermost growth band, whereas 8 of the shells from March had a dark color on the outermost growth band. Carry out a hypothesis test to see if there is a difference in the proportion of shells with a dark outermost growth band between the two months. The point estimate for the true difference in proportion of dark growth bands between February and March is:arrow_forwardMarine biologists have noticed that the color of the outermost growth band on a clam tends to be related to the time of year in which the clam dies. A biologist conducted a small investigation of whether this is true for the species Protothaca staminea. She collected a sample of 50 clam shells in February and 27 clam shells in March. 15 of the shells from February had a dark color on the outermost growth band, whereas 8 of the shells from March had a dark color on the outermost growth band. Carry out a hypothesis test to see if there is a difference in the proportion of shells with a dark outermost growth band between the two months. Let ? = 0.01. A) The point estimate for the true difference in proportion of dark growth bands between February and March is:arrow_forward
 Glencoe Algebra 1, Student Edition, 9780079039897...AlgebraISBN:9780079039897Author:CarterPublisher:McGraw Hill
 Algebra & Trigonometry with Analytic GeometryAlgebraISBN:9781133382119Author:SwokowskiPublisher:Cengage