
Concept explainers
Videos
Mediocre Grade Deflation. The bar graph shows the percentage of U.S. college freshmen with an average grade of C in high school.
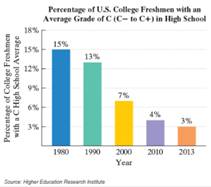
The data displayed by the bar graph can be described by the mathematical model
106.
a. According to the formula, in 2000, what percentage of U.S. college freshmen had an average grade of C in high school? Does this underestimate or overestimate the percent displayed by the bar graph? By how much?
b. According to the formula, how many years after 1980 will no more than 0.8% of college freshmen have an average grade of C in high school? Which years does this include?
Want to see the full answer?
Check out a sample textbook solution
Chapter 2 Solutions
Print Offer Introductory Algebra For College Students (7th Edition)


 Glencoe Algebra 1, Student Edition, 9780079039897...AlgebraISBN:9780079039897Author:CarterPublisher:McGraw Hill
 Trigonometry (MindTap Course List)TrigonometryISBN:9781337278461Author:Ron LarsonPublisher:Cengage Learning
 Algebra & Trigonometry with Analytic GeometryAlgebraISBN:9781133382119Author:SwokowskiPublisher:Cengage
 Holt Mcdougal Larson Pre-algebra: Student Edition...AlgebraISBN:9780547587776Author:HOLT MCDOUGALPublisher:HOLT MCDOUGAL
 College AlgebraAlgebraISBN:9781305115545Author:James Stewart, Lothar Redlin, Saleem WatsonPublisher:Cengage Learning
 Big Ideas Math A Bridge To Success Algebra 1: Stu...AlgebraISBN:9781680331141Author:HOUGHTON MIFFLIN HARCOURTPublisher:Houghton Mifflin Harcourt