Videos
The functions
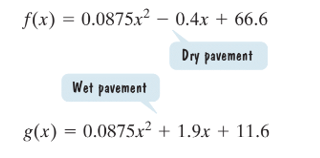
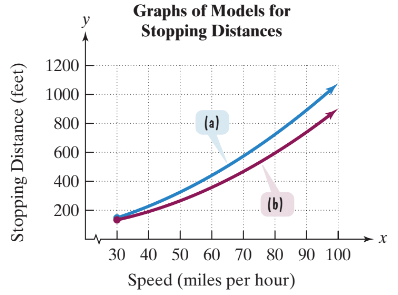
model a car's slopping distance, f(x) or g(x), in feel, traveling at x miles per hour. Function f models stopping distance on dry pavement and function g models stopping distance on wet pavement. The graphs of these functions are shown for
a. Use the given functions at the bottom of the previous page to find the slopping distance on dry pavement and the stopping distance on dry pavement for a car traveling at 55 miles per hour. Round to the nearest fool.
b. Based on your answers to part (a), which rectangular coordinate graph shows slopping distances on dry pavement and which shows slopping distances on wet pavement?
c. How well do your answers to part (a) model the actual slopping distances shown in Figure 2.45 on page 403?
d. Determine speeds on wet pavement requiring slopping distances that exceed the length of one and one-half football fields, or 540 feet. Round to the nearest mile per hour. How is this shown on the appropriate graph of the models?
Want to see the full answer?
Check out a sample textbook solution
Chapter 2 Solutions
Precalculus - Learning Guide With MyMathLab


 Trigonometry (MindTap Course List)TrigonometryISBN:9781337278461Author:Ron LarsonPublisher:Cengage Learning
 Glencoe Algebra 1, Student Edition, 9780079039897...AlgebraISBN:9780079039897Author:CarterPublisher:McGraw Hill
 Intermediate AlgebraAlgebraISBN:9781285195728Author:Jerome E. Kaufmann, Karen L. SchwittersPublisher:Cengage Learning
 Algebra for College StudentsAlgebraISBN:9781285195780Author:Jerome E. Kaufmann, Karen L. SchwittersPublisher:Cengage Learning
 Big Ideas Math A Bridge To Success Algebra 1: Stu...AlgebraISBN:9781680331141Author:HOUGHTON MIFFLIN HARCOURTPublisher:Houghton Mifflin Harcourt