
Videos
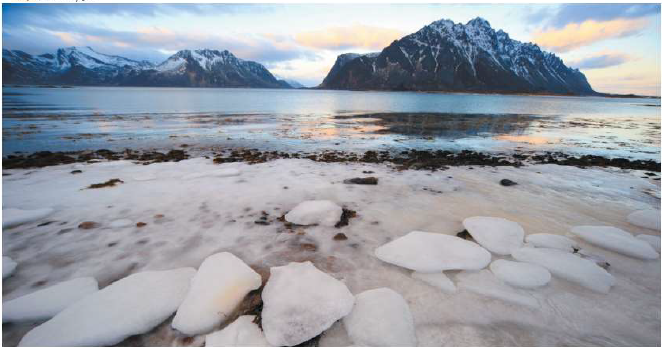
Rate of change of the Arctic ice cap. In a trend that scientists attribute, at least in part, to global warming, the floating cap of sea ice on the Arctic Ocean has been shrinking since 1980. The ice cap always shrinks in summer and grows in winter. Average minimum size of the ice cap, in square miles, can be approximated by
In 2013, the radius of the ice cap was approximately 792 mi and was shrinking at a rate of approximately 4.7 mi/yr. (Source: Based on data from nsidc.org.) How fast was the area changing at that time?
Want to see the full answer?
Check out a sample textbook solution
Chapter 2 Solutions
Calculus and Its Applications (11th Edition)
Additional Math Textbook Solutions
Thomas' Calculus: Early Transcendentals (14th Edition)
Calculus: Early Transcendentals (2nd Edition)
University Calculus: Early Transcendentals (4th Edition)
Single Variable Calculus: Early Transcendentals (2nd Edition) - Standalone book


- Flood Control A river is 8 feet above its flood stage. The water is receding at a rate of 3 inches per hour. Write a mathematical model that shows the number of feet above flood stage after t hours. Assuming the water continually recedes at this rate, when will the river be 1 foot above its flood stage?arrow_forwardGrazing Kangaroos The amount of vegetation eaten in a day by a grazing animal V of food available measured as biomass, in units such as pounds per acre. This relationship is called the functional response. If there is little vegetation available, the daily intake will be small, since the animal will have difficulty finding and eating the food. As the amount of food biomass increases, so does the daily intake. Clearly, though, there is a limit to the amount the animal will eat, regardless of the amount of food available. This maximum amount eaten is the satiation level. a.For the western grey kangaroo of Australia, the functional response is G=2.54.8e0.004V, where G=G(V) is the daily intake measured in pounds and V is the vegetation biomass measured in pounds per acre. i. Draw a graph of G against V. Include vegetation biomass levels up to 2000 pounds per acre. ii. Is the graph you found in part i concave up or concave down? Explain in practical terms what your answer means about how this kangaroo feeds. iii. There is a minimal vegetation biomass level below which the western grey kangaroo will eat nothing. Another way of expressing this is to say that the animal cannot reduce the food biomass below this level. Find this minimal level. iv. Find the satiation level for the western grey kangaroo. b. For the red kangaroo of Australia, the functional response is R=1.91.9e0.033V, Where R is the daily intake measured in pounds and V is the vegetation biomass measured in pounds per acre. i. Add the graph of R against V to the graph of G you drew in part a. ii. A simple measure of the grazing efficiency of an animal involves the minimal vegetation biomass level described above: The lower the minimal level for an animal, the more efficient it is at grazing. Which is more efficient at grazing, the western grey kangaroo or the red kangaroo?arrow_forwardHeight of a Ball If a ball is thrown directly upward with a velocity of 40 ft/s, its height (in feet) after t seconds is given by y=40t16t2 . What is the maximum height attained bythe ball?arrow_forward

 Algebra & Trigonometry with Analytic GeometryAlgebraISBN:9781133382119Author:SwokowskiPublisher:Cengage
 College AlgebraAlgebraISBN:9781305115545Author:James Stewart, Lothar Redlin, Saleem WatsonPublisher:Cengage Learning
 Algebra and Trigonometry (MindTap Course List)AlgebraISBN:9781305071742Author:James Stewart, Lothar Redlin, Saleem WatsonPublisher:Cengage Learning
 Functions and Change: A Modeling Approach to Coll...AlgebraISBN:9781337111348Author:Bruce Crauder, Benny Evans, Alan NoellPublisher:Cengage Learning