Videos
Financial ratios* As you can see, someone has spilled ink over some of the entries in the
- Long-term debt ratio: .4.
- Times-interest-earned: 8.0.
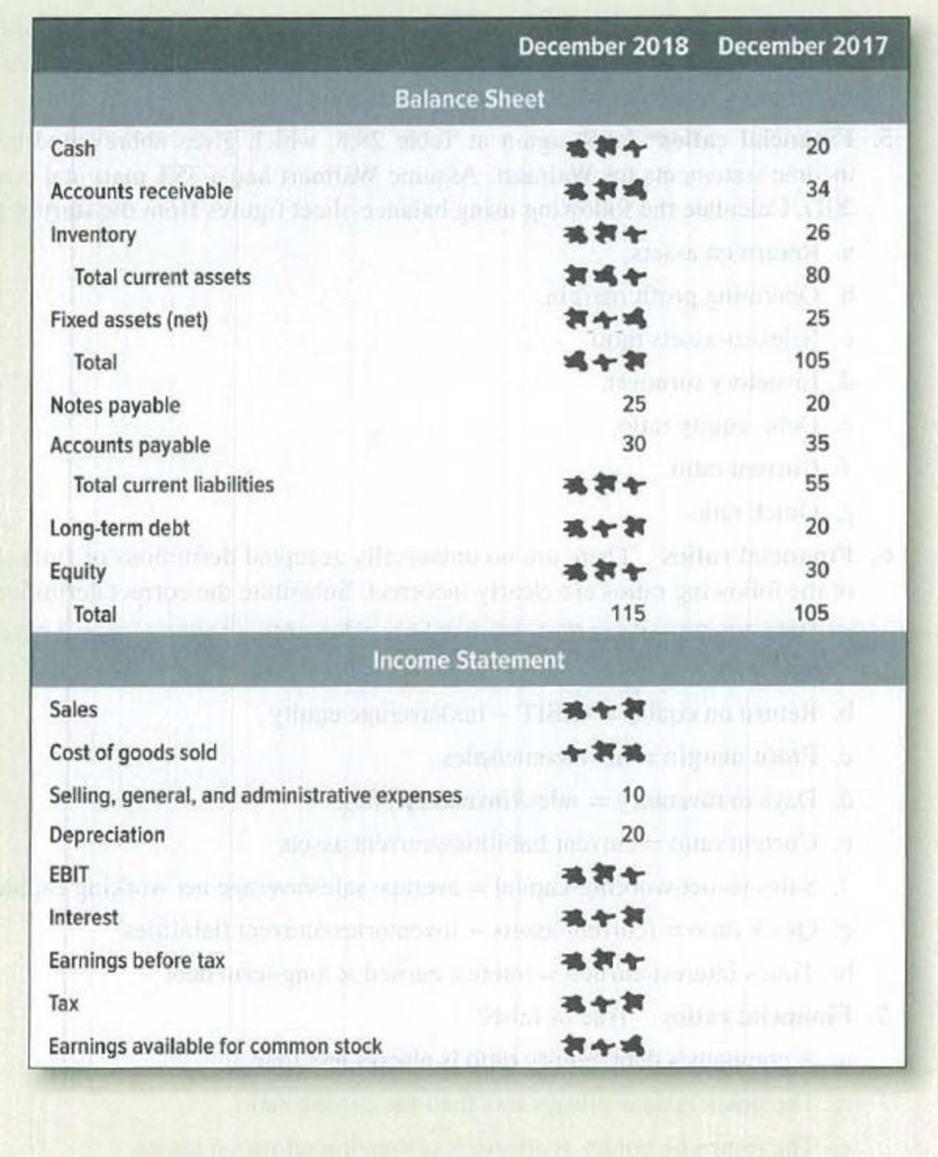
- Current ratio: 1.4.
- Quick ratio: 1.0.
- Cash ratio: .2.
- Inventory turnover: 5.0.
- Receivables collection period: 73 days. Tax rate = .4.
To determine: Various financial ratios to complete the balance sheet.
Explanation of Solution
Given information:
Long term debt ratio is 0.4
Times-interest earned is 8.0
Current ratio is 1.4
Cash ratio is 0.2
Inventory turnover ratio is 5.0
Tax rate is 0.40
Quick ratio is 1.0
Calculation of financial ratios:
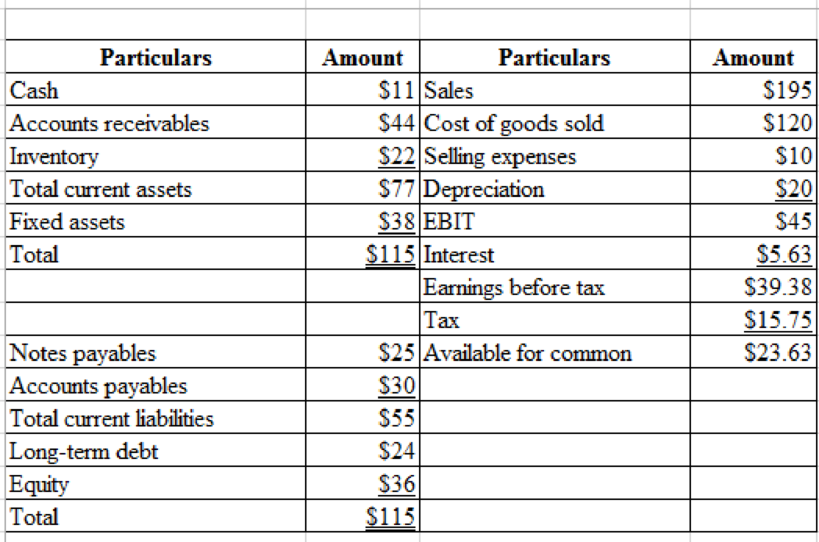
Therefore, total assets is $115
Therefore, total current liabilities is $55
Therefore, total current assets is $77
Hence, cash is $11
Therefore, accounts receivables is $44
Therefore, inventory is $22
Therefore, fixed assets are $38
Therefore, long-term debt and equity is $60
Therefore, long-term debt is $24
Therefore, equity is $36
For completing the balance sheet the following ratios are needed,
Therefore, average inventory is $24
Therefore, Cost of goods sold is $120
Therefore, average receivables is $39
Therefore, sales is $195
Therefore, EBIT is $45.
Therefore, interest is $5.625
Therefore, interest is $39.375
Therefore, tax is $15.75
Therefore, company balance sheet is as follows,
Want to see more full solutions like this?
Chapter 28 Solutions
EBK PRINCIPLES OF CORPORATE FINANCE


- FINANCIAL RATIOS Based on the financial statements for Jackson Enterprises (income statement, statement of owners equity, and balance sheet) shown on pages 596597, prepare the following financial ratios. All sales are credit sales. The Accounts Receivable balance on January 1, 20--, was 21,600. 1. Working capital 2. Current ratio 3. Quick ratio 4. Return on owners equity 5. Accounts receivable turnover and average number of days required to collect receivables 6. Inventory turnover and average number of days required to sell inventoryarrow_forwardFINANCIAL RATIOS Use the work sheet and financial statements prepared in Problem 15-8A. All sales are credit sales. The Accounts Receivable balance on January 1,20--, was 3,800. REQUIRED Prepare the following financial ratios: (a) Working capital (b) Current ratio (c) Quick ratio (d) Return on owners equity (e) Accounts receivable turnover and average number of days required to collect receivables (f) Inventory turnover and average number of days required to sell inventoryarrow_forwardFINANCIAL RATIOS Based on the financial statements, shown on pages 605606, for McDonald Carpeting Co. (income statement, statement of owners equity, and balance sheet), prepare the following financial ratios. All sales are credit sales. The balance of Accounts Receivable on January 1, 20--, was 6,800. 1. Working capital 2. Current ratio 3. Quick ratio 4. Return on owners equity 5. Accounts receivable turnover and the average number of days required to collect receivables 6. Inventory turnover and the average number of days required to sell inventoryarrow_forward
- FINANCIAL RATIOS Based on the financial statements, shown on pages 603604, for McDonald Carpeting Co. (income statement, statement of owners equity, and balance sheet), prepare the following financial ratios. All sales are credit sales. The balance of Accounts Receivable on January 1, 20--, was 6,800. 1. Working capital 2. Current ratio 3. Quick ratio 4. Return on owners equity 5. Accounts receivable turnover and average number of days required to collect receivables 6. Inventory turnover and average number of days required to sell inventoryarrow_forwardThe following selected information is taken from the financial statements of Arnn Company for its most recent year of operations: During the year, Arnn had net sales of 2.45 million. The cost of goods sold was 1.3 million. Required: Note: Round all answers to two decimal places. 1. Compute the current ratio. 2. Compute the quick or acid-test ratio. 3. Compute the accounts receivable turnover ratio. 4. Compute the accounts receivable turnover in days. 5. Compute the inventory turnover ratio. 6. Compute the inventory turnover in days.arrow_forwardFINANCIAL RATIOS Use the spreadsheet and financial statements prepared in Problem 15-8A. All sales are credit sales. The Accounts Receivable balance on January 1, 20--, was 10,200. REQUIRED Prepare the following financial ratios: (a) Current ratio (b) Quick ratio (c) Working capital (d) Return on owners equity (e) Accounts receivable turnover and average number of days required to collect receivables (f) Inventory turnover and average number of days required to sell inventoryarrow_forward
- Last year, Nikkola Company had net sales of 2,299,500,000 and cost of goods sold of 1,755,000,000. Nikkola had the following balances: Refer to the information for Nikkola Company above. Required: Note: Round answers to one decimal place. 1. Calculate the average inventory. 2. Calculate the inventory turnover ratio. 3. Calculate the inventory turnover in days. 4. CONCEPTUAL CONNECTION Based on these ratios, does Nikkola appear to be performing well or poorly?arrow_forwardUSE TGHE FOLLOWING TO SOLVE FOR QUESTION7 ONLY Tooele Company’s controller estimated bad debt expense using the percentage of accountsreceivable method. Total sales for the year were $500,000 of which 250,000 are on account.The ending balance in accounts receivable was $100,000. An examination of the outstandingaccounts at the end of the year indicates that approximately 12 percent of these accounts willultimately prove to be uncollectible. Before any adjusting entries, the balance in theAllowance for Doubtful Accounts is $700 (CREDIT). Which is part of the correct adjustingentry to record bad debt expense for the year?(The Allowance for Doubtful Accounts is also known as the Allowance for Bad Debts or theAllowance for Uncollectible Accounts.)a. CREDIT Allowance for Bad Debts for $11,300b. DEBIT Allowance for Bad Debts for $11,300c. CREDIT Allowance for Bad Debts for $12,000d. CREDIT Allowance for Bad Debts for $12,700e. DEBIT Allowance for Bad Debts for $14,700 5. Use the…arrow_forwardINSTRUCTIONS Determine the following measures for both 20Y8 and 20Y9, rounding percentages and ratios other than per-share amounts to one decimal place. Briefly explain how or why management would use this information and comment on the trend from 20Y8 and 20Y9. Working capital Current ratio Quick ratio Accounts receivable turnover Number of days’ sales in receivables Inventory turnover Number of days’ sales in inventory Ratio of fixed assets to long-term liabilities Ratio of liabilities to stockholders’ equity Times interest earned Asset turnover Return on total assets Return on stockholders’ equity Return on common stockholders’ equity Earnings per share on common stock Price-earnings ratio Dividends per share Dividend yieldarrow_forward
- Financial Analysis The following financial results are shown for East, Inc. and West, Inc. Ratios East, Inc. West, Inc. Current ratio 2.3 2.6 Acid test ratio 1.2 1.4 Accounts receivable turnover 8.4 times 8.8 times Inventory turnover 4.7 times 5.1 times Days sales in inventory 64 days 59 days Days sales uncollected 34.2 days 29.7 days Profit margin ratio 3.2% 2.8% Total asset turnover 1.1 .9 Return on common stockholder’ equity 4.6% 4.1% Price earnings ratio 18.3 28.8 Dividend yield .89% .90 Debt ratio .62 .68 Times interest earned 2.6 times 2.2 times From the above financial data, prepare two separate memos. In the first memo, determine which of the two companies would be the better short-term credit risk and explain why. In the second memo, determine which of the two companies the better investment is and explain why. Your explanations must mention the exact ratios and…arrow_forwardComplete the balance sheet and sales information using the following financial data:Total assets turnover: 1.1×Days sales outstanding: 73.0 daysaInventory turnover ratio: 4×Fixed assets turnover: 2.5×Current ratio: 2.0×Gross profit margin on sales: (Sales - Cost of goods sold)/Sales = 20%aCalculation is based on a 365-day year. Do not round intermediate calculations. Round your answers to the nearest dollar. Balance Sheet Cash $ Current liabilities $ Accounts receivable Long-term debt 54,000 Inventories Common stock Fixed assets Retained earnings 108,000 Total assets $360,000 Total liabilities and equity $ Sales $ Cost of goods sold $arrow_forwardCalculate the following financial ratios for Phone Corporation: (Use 365 daysin a year. Do not round intermediate calculations. Round your finalanswers to 2 decimal places.)1. Return on Assets (use average balance sheet figures)2. Return on capital (use average balance sheet figures) %3. Days in inventory (use start of year balance sheet figures) %4. Inventory turnover (use start of year balance sheet figures5. Average collection period (use start of year balance sheet figures)6. Operating profit margin %7. Long term debt ratio (use end of year balance sheet figures)8. Total Debt ratio (use end of year balance sheet figures)arrow_forward
 College Accounting, Chapters 1-27 (New in Account...AccountingISBN:9781305666160Author:James A. Heintz, Robert W. ParryPublisher:Cengage Learning
 College Accounting, Chapters 1-27AccountingISBN:9781337794756Author:HEINTZ, James A.Publisher:Cengage Learning,
 Managerial Accounting: The Cornerstone of Busines...AccountingISBN:9781337115773Author:Maryanne M. Mowen, Don R. Hansen, Dan L. HeitgerPublisher:Cengage Learning
 Financial Accounting: The Impact on Decision Make...AccountingISBN:9781305654174Author:Gary A. Porter, Curtis L. NortonPublisher:Cengage Learning