
Concept explainers
Videos
1.
Introduction:
Variable costs and Fixed costs:
Variable costs are those that increase or decrease with the general volume of work. Some of the examples of variable costs are sales commissions, labor costs, raw material costs, etc. Fixed costs are those costs that remain fixed irrespective of the volume of work. Some of the examples of fixed costs are office rent, administrative expenses,
Least square regression method:
The least-square regression method uses the regression line to classify the total cost into variable and fixed cost and thus minimizing the sum of squares of the errors and hence we can get the best line of fit with minimum variances. The least-square regression can be expressed as Y = a + bx
Where Y is Total cost
A is the total fixed cost
B is the variable cost
X is the activity level
To prepare: a scatter plot graph.
1.
Answer to Problem 2A.2E
This is the scatterplot graph for the B rental car.
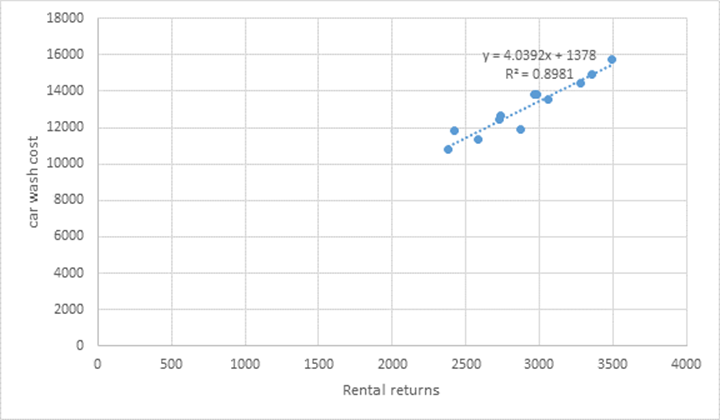
Explanation of Solution
According to the given information the rental returns and car wash costs of B rental cars have been given and we have to prepare a scatter graph plot where the car wash cost should be on the vertical axis and the rental returns on the horizontal axis. To prepare the scatter graph first we have to go to insert option and select scatter graph from charts. The next step is to enter the X values and Y values and then we will get the graph. Now we can add trend line and axis title by clicking on the + symbol next to the graph. After adding the trend line we can click on the arrow button next to the trend line and select more options and then in that we have to checkmark display equation and display R squared value on the chart. The following is the data for plotting the graph:
| Rental returns | Car wash costs ($) |
| 2380 | 10825 |
| 2421 | 11865 |
| 2586 | 11332 |
| 2725 | 12422 |
| 2968 | 13850 |
| 3281 | 14419 |
| 3353 | 14935 |
| 3489 | 15738 |
| 3057 | 13563 |
| 2876 | 11889 |
| 2735 | 12683 |
| 2983 | 13796 |
2.
Introduction:
Variable costs are those that increase or decrease with the general volume of work. Some of the examples of variable costs are sales commissions, labor costs, raw material costs, etc. Fixed costs are those costs that remain fixed irrespective of the volume of work. Some of the examples of fixed costs are office rent, administrative expenses, depreciation, etc.
Least square regression method:
The least-square regression method uses the regression line to classify the total cost into variable and fixed cost and thus minimizing the sum of squares of the errors and hence we can get the best line of fit with minimum variances. The least-square regression can be expressed as Y = a + bx
Where Y is Total cost
A is the total fixed cost
B is the variable cost
X is the activity level
To calculate: the variable cost per rental return and the monthly fixed washing cars using least square regression method.
2.
Answer to Problem 2A.2E
Thus, the variable cost per unit is $4.04 and the fixed cost per unit is $145583 for Bargain rental car.
Explanation of Solution
To calculate the variable cost per rental return and the monthly fixed washing cars using the least square regression method first we have to calculate the X, Y, X2 and XY. In the given data the rental return is taken as X and car wash costs is taken as Y, let us now calculate the X2 and XY:
| Months | X | Y | X2 | XY |
| January | 2380 | 10825 | 5664400 | 25763500 |
| February | 2421 | 11865 | 5861241 | 28725165 |
| March | 2586 | 11332 | 6687396 | 29304552 |
| April | 2725 | 12422 | 7425625 | 33849950 |
| May | 2968 | 13850 | 8809024 | 41106800 |
| June | 3281 | 14419 | 10764961 | 47308739 |
| July | 3353 | 14935 | 11242609 | 50077055 |
| August | 3489 | 15738 | 12173121 | 54909882 |
| September | 3057 | 13563 | 9345249 | 41462091 |
| October | 2876 | 11889 | 8271376 | 34192764 |
| November | 2735 | 12683 | 7480225 | 34688005 |
| December | 2983 | 13796 | 8898289 | 41153468 |
| Total | 34854 | 157317 | 102623516 | 462541971 |
Now let us calculate the variable cost using following formula:
Variable cost per unit
Now, let us calculate the fixed cost per unit using following formula:
Fixed cost per unit
Want to see more full solutions like this?
Chapter 2A Solutions
Connect Access Card For Managerial Accounting For Managers


- Make or Buy Analysis [LO 7–3]“In my opinion, we ought to stop making our own drums and accept that outside supplier’s offer,” said Wim Niewindt, managing director of Antilles Refining, N.V., of Aruba. “At a price of $18 per drum, we would be paying $5 less than it costs us to manufacture the drums in our own plant. Since we use 60,000 drums a year, that would be an annual cost savings of $300,000.” Antilles Refining’s current cost to manufacture one drum is given below (based on 60,000 drums per year): Direct materials............................................$10.35 Direct labor ...............................................6.00 Variable overhead .........................................1.50 Fixed overhead ($2.80 general company overhead, $1.60 depreciation and, $0.75 supervision) ....... 5.15 Total cost per drum ........................................$23.00 A decision about whether to make or buy the drums is especially important at this time because the equipment being used to…arrow_forward3-30. CVP Analysis—Ethical Issues Mark Ting desperately wants his proposed new product, DNA-diamond, to be accepted by top management. DNA-diamond is a piece of jewelry that contains the DNA of a partner, spouse, or other loved one. Top management will not approve this product in view of its high break-even point. Mark knows that if he can reduce the fixed costs in his proposal, then the break-even point will be reduced to a level that top management finds acceptable. Working with a friend in the company’s finance department, Mark finds ways to credibly misstate the estimated fixed costs of producing DNA-diamonds below those that any objective person would estimate. Mark knows that if the product is successful (and he is certain that it will be), then top management will not find out about the understatement of fixed costs. Mark believes that this product, once it is successful, will benefit the shareholders and employees of the company. Are Mark’s actions ethical? Explain.arrow_forward3-30. CVP Analysis—Ethical Issues Mark Ting desperately wants his proposed new product, DNA-diamond, to be accepted by top management. DNA-diamond is a piece of jewelry that contains the DNA of a partner, spouse, or other loved one. Top management will not approve this product in view of its high break-even point. Mark knows that if he can reduce the fixed costs in his proposal, then the break-even point will be reduced to a level that top management finds acceptable. Working with a friend in the company’s finance department, Mark finds ways to credibly misstate the estimated fixed costs of producing DNA-diamonds below those that any objective person would estimate. Mark knows that if the product is successful (and he is certain that it will be), then top management will not find out about the understatement of fixed costs. Mark believes that this product, once it is successful, will benefit the shareholders and employees of the company. Required Are Mark’s actions ethical? Explain.arrow_forward
- Chapter 3 Problem A8 Jakara Company is a service firm with current service revenue of $400,000 and a 40% contribution margin. Its fixed costs are $80,000. Maldives Company has current sales of $6,610,000 and a 45% contribution margin. Its fixed costs are $1,800,000. A. What is the margin of safety for Jakarta and Maldives? B. Compare the margin of safety in dollars between the two companies. Which is stronger? C. Compare the margin of safety in percentage between the two companies. Now, which one is stronger? D. Compute the degree of operating leverage for both companies. Which company will benefit most from a 15% increase in sales? Explain why. Illustrate your findings in an Income Statement that is increased by 15%.arrow_forwardAIP 4.1 Target Costing and Product Mix LO 4The Peter Paint Company makes water- and oil-based paints for houses. Recently, the firm has been investigating other opportunities. One possibility is producing ‘finger paints’ for children. Finger paints are considerably different from house paints, since they must be designed and produced to be easily washable. The marketing people at Peter Paint believe that there is an opportunity to enter this new market. They estimatethat the company could sell 1 million units of finger paints annually for $1 per unit. Questiona. How should Peter Paint use this information in making a decision to add finger paints to its product mix?arrow_forward1. Find the break-even point in terms of dollars. 2. Find the margin of safety in terms of dollars. 3. The company is considering decreasing product K's unit sales to 80,000 and increasing product L's unit sales to 180,000, leaving unchanged the selling price per unit, variable expense per unit, and total fixed expenses. Would you advise adopting this plan? Indicate the advantage or disadvantage of the new plan over the current operations. Ex. YES 12345 ADVANTAGE or NO 12345 DISADVANTAGEarrow_forward
- Tutorial Q. 5 Assuming that the cost structure and selling prices remain the same in Periods I and II, as given below: Period Sales (RM) Profit (RM) 1 240,000 18,000 2 280,000 26,000 a. Now find out what is the profit when sales are RM200,000, additionally calculate the sales required to earn a profit of RM40,000. b. Margin of safety at a profit of RM30,000 c. Variable cost in Period II.arrow_forwardEXERCISE 6–13 Target Profi t and Break-Even Analysis [ LO3 , LO4 , LO5 , LO6 ]Lindon Company is the exclusive distributor for an automotive product that sells for $40 per unitand has a CM ratio of 30%. The company’s fi xed expenses are $180,000 per year. The companyplans to sell 16,000 units this year.Required:1. What are the variable expenses per unit?2. Using the equation method:a. What is the break-even point in units and sales dollars?b. What sales level in units and in sales dollars is required to earn an annual profi t of$60,000?c. Assume that by using a more effi cient shipper, the company is able to reduce its variableexpenses by $4 per unit. What is the company’s new break-even point in units and salesdollars?3. Repeat (2) above using the formula methodarrow_forward6.9. Soft Key is trying to determine how best to produce its newest product, DVORK keyboards. The keyboards could be produced in-house using either process A or process B, or purchased from a supplier. Cost data are given below. For what levels of demand should each process be chosen? Fixed Cost Variable CostProcess A $ 8,000 $10Process B $20,000 $ 4Supplier $ 0 $20arrow_forward
- Don't use chatgpt, I will 5 upvotes question 5 For the current year, Electric Corporation expected to sell 42,300 industrial power cords. Fixed costs were expected to total $1,651,500; unit sales price was expected to be $3,900; and unit variable costs were budgeted at $2,400. Electric Corporation's margin of safety (MOS) in sales dollars is: (Do not round intermediate calculations.) A. $160,676,100. B. $194,851,099. C. $166,596,097. D. $178,401,100. E. $150,226,100. A B C D Earrow_forward6 . Individual Problems 19-5 Soft selling occurs when a buyer is skeptical of the usefulness of a product and the seller offers to set a price that depends on realized value. For example, suppose a sales representative is trying to sell a company a new accounting system that will, with certainty, reduce costs by 20%. However, the customer has heard this claim before and believes there is only a 10% chance of actually realizing that cost reduction and a 90% chance of realizing no cost reduction. Assume the customer has an initial total cost of $500. According to the customer's beliefs, the expected value of the accounting system, or the expected reduction in cost, is . Suppose the sales representative initially offers the accounting system to the customer for a price of $55.00. The information asymmetry stems from the fact that the has less information about the efficacy of the accounting system than does the . At this price, the customer purchase the…arrow_forwardQUESTION 9 QRC Company is trying to decide which one of two alternatives it will accept. The costs and revenues associated with each alternative are listed below: Alternative A Alternative B Projected revenue $ 62,500 $ 75,000 Unit-level costs 12,500 18,000 Batch-level costs 6,250 12,000 Product-level costs 7,500 8,500 Facility-level costs 5,000 6,250 What is the differential revenue for this decision? $62,500 $25,000 $75,000 $12,500arrow_forward
 AccountingAccountingISBN:9781337272094Author:WARREN, Carl S., Reeve, James M., Duchac, Jonathan E.Publisher:Cengage Learning,
 Financial & Managerial AccountingAccountingISBN:9781337119207Author:Carl Warren, James M. Reeve, Jonathan DuchacPublisher:Cengage Learning
 Financial & Managerial AccountingAccountingISBN:9781285866307Author:Carl Warren, James M. Reeve, Jonathan DuchacPublisher:Cengage Learning
 Pkg Acc Infor Systems MS VISIO CDFinanceISBN:9781133935940Author:Ulric J. GelinasPublisher:CENGAGE L