Videos
Least-Squares Regression; Scattergraph; Comparison of Activity Bases [LO 2-4, LO 2-8]
The Hard Rock Mining Company is developing cost formulas for management planning and decision-making purposes. The company’s cost analyst has concluded that utilities cost is a mixed cost, and he is attempting to find a base with which the cost might be closely correlated. The controller has suggested that tons mined might be a good base to use in developing a cost formula. The production superintendent disagrees; she thinks that direct labor-hours would be a better base. The cost analyst has decided to try both bases and has assembled the following information:
![Chapter 2A, Problem 2A.3P, Least-Squares Regression; Scattergraph; Comparison of Activity Bases [LO 2-4, LO 2-8] The Hard Rock](http://dev-ingestion-image-output.s3-website-us-east-1.amazonaws.com/9781259578540/Chapter-2A/images/html_q_78540-2a-2a.3p_1.png)
Required:
- Using tons mined as the independent variable: prepare a scattergraph that plots tons mined on the horizontal axis and utilities cost on the vertical axis. Determine a cost formula for utilities cost using least-squares regression- Express this cost formula in the form
- Using direct labor-hours as the independent variable: prepare a scattergraph that plots direct labor-hours on the horizontal axis and utilities cost on the vertical axis- Determine a cost formula for utilities cost using least-squares regression. Express this cost formula in the form
- Would you recommend that the company use tons mined or direct labor-hours as a base for planning utilities cost?
1.
Concept Introduction:
Scatter-graph:Scatter-graph implies the visual presentation of data on the graph in which costs are shown on the y-axis and activity level is presented in the x-axis.
Least-square regression: Least square regression method use all the available data to derive the best fitting line which would minimize the sum of squared errors between the data points and the regression line.
To prepare:The scatter diagram using tons mixed and utilities cost and determine cost formula
Explanation of Solution
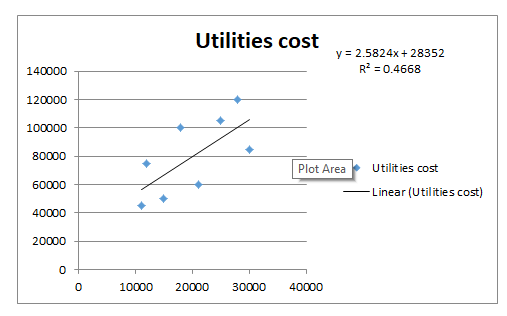
The cost formula is Y=28352+2.58X where, Y is the utilities cost and X is the tons mixed.
Thus, the scatter diagram has been prepared, and least square regression has been performed and cost equation has been determined.
2.
Concept Introduction:
Scatter-graph:Scatter-graph implies the visual presentation of data on the graph in which costs are shown on the y-axis and activity level is presented in the x-axis.
Least-square regression: Least square regression method use all the available data to derive the best fitting line which would minimize the sum of squared errors between the data points and the regression line
To prepare:The scatter diagram using tons mixed and utilities cost and determine cost formula
Explanation of Solution
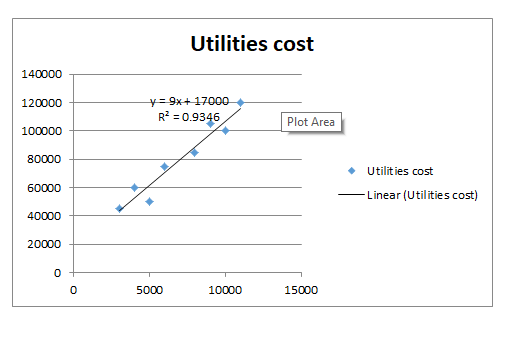
The cost formula is Y=17000+9X where, Y is the utilities cost and X is the direct labor hours Thus, the scatter diagram has been prepared, and least square regression has been performed and cost equation has been determined.
3.
Concept Introduction:
Scatter-graph:Scatter-graph implies the visual presentation of data on the graph in which costs are shown on the y-axis and activity level is presented in the x-axis.
Least-square regression: Least square regression method use all the available data to derive the best fitting line which would minimize the sum of squared errors between the data points and the regression line
The activities to be selected as as a base for planning utilities cost
Answer to Problem 2A.3P
Direct labor hours should be taken as a base for planning utilities costs.
Explanation of Solution
The regression coefficient is 0.9346 when direct labor is taken as base whereas it is 0.4668 when tons mined is taken as base. Regression coefficient determines the accuracy with which the costs can be determined. Thus taking direct labor as base, the costs can be determined with 93.46% accuracy whereas the accuracy percentage is only 46.68% when tons mined are taken as base. Thus, the activity to be taken as a base for planning utilities cost has been determined.
Want to see more full solutions like this?
Chapter 2A Solutions
Managerial Accounting for Managers


- Because of high production-changeover time and costs, a director of manufacturing must convince management that a proposed manufacturing method reduces costs before the new method can be implemented. The current production method operates with a mean cost of $220 per hour. A research study will measure the cost of the new method over a sample production period. Develop the null and alternative hypotheses most appropriate for this study. Comment on the conclusion when H0 cannot be rejected. Comment on the conclusion when H0 can be rejected.arrow_forwardThe Connors Company has assembled the following data pertaining to certain costs that cannot beeasily identified as either fixed or variable. Connors Company has heard about a method of measuringcost functions called the high-low method and has decided to use it in this situation.A company has heard about a method of measuring cost functions called the regression analysis and hasdecided to use it in this situation.Cost Hours$23,000 5,000$26,000 6,450$34,600 7,650$42,000 10,000$38,000 9,350What is the estimated total cost at an operating level of 9,000 hours?A) $34,200B) $38,200C) $41,400D) $37,800 Work question #7 using regression analysisarrow_forwardLeast-Squares Regression Method; Scattergraph; Cost Behavior Professor John Morton has just been appointed chairperson of the Finance Department at Westland University. In reviewing the department’s cost records. Professor Morton has found the following total cost associated with Finance 101 over the last five terms: Professor Morton knows that there are some variable costs, such as amounts paid to graduate assistants, associated with the course. He would like to have the variable and fixed costs separated for planning purposes. Required: 1. Prepare a scattergraph plot. (Plot total cost on the vertical axis and number of sections offered on the horizontal axis.) 2. Using the least-squares regression method, estimate the variable cost per section and the total fixed cost per term for Finance 101. Express these estimates in the form Y = a + bX. 3. Assume that because of the small number of sections offered during the Winter Term this year. Professor Morton will have to offer eight…arrow_forward
- In response to a request from your immediate supervisor, you have prepared a CVP graphportraying the cost and revenue characteristics of your company’s product and operations.Explain how the lines on the graph and the break-even point would change if ( a ) the selling priceper unit decreased, ( b ) fixed cost increased throughout the entire range of activity portrayed onthe graph, and ( c ) variable cost per unit increased.arrow_forward1.A: TRUE FALSE The suitable cost unit for electricity is Kilowatt Hours Cost centers are a quantitative unit of product or services to which cost can be related. Variable cost is the cost that changes as the level of output changes. Cost involved in creating, testing and developing product is classified as research development cost.arrow_forwardT, F. In order to avoid the transfer of inefficiencies of service departments to operating departments, service departments should charge operating departments standards cost rather than actual costs. T, F. Standard is a bench mark for performance measurement and reward. T, F. Price Variances in materials costs are the differences between standard and actual costs due to fluctuations in the price paid for raw materials. T, F. Quantity variance in material costs are the differences between standard and actual costs due to fluctuations in the quantities of materials budgeted. T. F. Labor rate variances are the differences between standard and actual costs due to fluctuations in wage rates. T, F. Efficiency variances in labor costs are the differences between standard and actual costs due to fluctuations in the number of labor hours required to complete a product or job.arrow_forward
- A regression equation is set up, where the dependent variable is total costs and the independent variable is production. A correlation coefficient of 0.70 implies that: The coefficient of determination is negative. The level of production explains 49% of the variation in total costs There is a slightly inverse relationship between production and total costs. A correlation coefficient of 1.30 would produce a regression line with better fit to the data.arrow_forwardABC systems get more accurate as more activities are identified and analyzed. Critique the following statement: “A company should look to break its production process into as many activities as possible in order to determine the most accurate unit costs possible”. Why do you agree or disagree with that statement? Give several reasons.arrow_forwardThe production manager wants to achieve real and permanently decrease in the unit cost of the product. As you are the cost accountant of the company, which of the following concepts explains about real and permeant decrease in the unit cost of the product? a. Cost estimation b. Cost analysis c. Cost control d. Cost reductioarrow_forward
- Which of the following statements is true with respect to the performance metrics useful for productivity improvement? A)Cost of quality can be a useful measure for improvements conducted in one department of a company (INCORRECT) B)When the number of the indirect labor increases in relation to the direct labor, the productivity increases C)When the lead time to work content in a process is nearly equal, the process is likely to have very little waste D)When the First Pass Yield is more, we have greater opportunity to detect defects in the process when it is executedarrow_forwardTarget costing A target cost is 'a product cost estimate derived by subtracting the desired profit margin from a competitive market price. (CIMA, 2005). Required: The target costing is cost management techniques, and discuss the advantages of using this technique within firms.arrow_forwardActivity-based costing tends to pass the cost-benefit test for companies with A. Operations that are relatively simple B. Many products that use different amounts of resources C. Many products that use about the same amount of resources D. Few products that use about the same amount of resourcesarrow_forward
 Essentials of Business Analytics (MindTap Course ...StatisticsISBN:9781305627734Author:Jeffrey D. Camm, James J. Cochran, Michael J. Fry, Jeffrey W. Ohlmann, David R. AndersonPublisher:Cengage Learning
 Cornerstones of Cost Management (Cornerstones Ser...AccountingISBN:9781305970663Author:Don R. Hansen, Maryanne M. MowenPublisher:Cengage Learning