
Concept explainers
Videos
Listed below are measured weights (in pounds) of the contents in samples of cans of regular Pepsi and Diet Pepsi. Use these data for Exercises 1–3
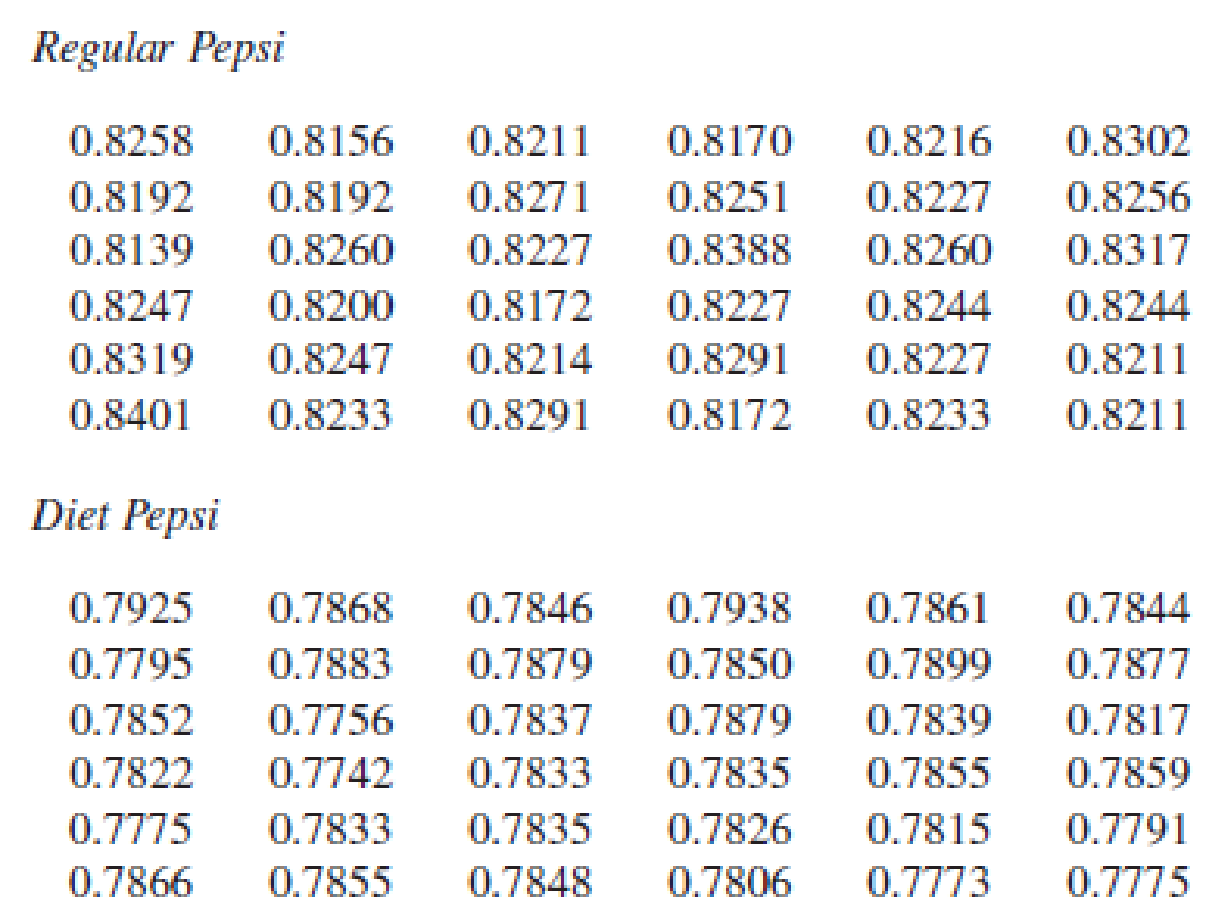
1.
- a. Construct a frequency table for the weights of regular Pepsi. Use these bins:
0.8130–0.8179
0.8180–0.8229
0.8230–0.8279
0.8280–0.8329
0.8330–0.8379
0.8380–0.8429
- b. Construct a frequency table for the weights of Diet Pepsi. Use these bins:
0.7740–0.7779
0.7780–0.7819
0.7820–0.7859
0.7860–0.7899
0.7900–0.7939
- c. Compare the frequency tables from parts (a) and (b). What notable differences are there? How can those notable differences be explained?
a.
Create a frequency table for the weights of regular Pepsi using the given bins.
Answer to Problem 1CRE
The relative frequency table for the weights of regular Pepsi using the given bins is as follows,
| Weights | Frequency |
| 0.8130–0.8179 | 5 |
| 0.8180–0.8229 | 12 |
| 0.8230–0.8279 | 12 |
| 0.8280–0.8329 | 5 |
| 0.8330–0.8379 | 0 |
| 0.8380-0.8429 | 2 |
| Total | 36 |
Explanation of Solution
Calculation
The given information is that,the data represents the weights (in pounds) of the contents in samples of cans of Regular Pepsi and Diet Pepsi.
From the data it is observed that, the values are ranging from 0.8139 to 0.8401. One-way to arrange the data in a group with these bins are classify the weights into different groups. Those are, 0.8130-0.8179, 0.8180-0.8229, 0.8230-0.8279, 0.8280-0.8329, 0.8330-0.8379 and 0.8380-0.8429.
Now, count the frequency for each bin. That is, 5 for bin 0.8130-0.8176 because in that range there are 5 cans and for bin 0.8180-0.8229, 12. Similarly the remaining frequencies are obtained and tabulated below.
The frequency table is as follows,
| Weights | Frequency |
| 0.8130–0.8179 | 5 |
| 0.8180–0.8229 | 12 |
| 0.8230–0.8279 | 12 |
| 0.8280–0.8329 | 5 |
| 0.8330–0.8379 | 0 |
| 0.8380–0.8429 | 2 |
| Total | 36 |
b.
Create a frequency table for the weights of Diet Pepsi.
Answer to Problem 1CRE
The frequency table for the weights of Diet Pepsi is as follows,
| Weights | Frequency |
| 0.7740–0.7779 | 5 |
| 0.7780–0.7819 | 5 |
| 0.7820–0.7859 | 16 |
| 0.7860–0.7899 | 8 |
| 0.7900–0.7939 | 2 |
| Total | 36 |
Explanation of Solution
Calculation
From the data it is observed that, the values are ranging from 0.7742 to 0.7938. The groups for the weights of different bins are 0.7740-0.7779, 0.7780-0.7819, 0.7820-0.7859, 0.7860-0.7899 and 0.7900-0.7939.
Now, count the frequency for each bin. That is, 5 for bin 0.7740-0.7779 because in that range there are 5 cans and for bin 0.7780-0.7819, 5. Similarly the frequencies for remaining bins are obtained and tabulated below.
The frequency table is as follows,
| Weights | Frequency |
| 0.7740–0.7779 | 5 |
| 0.7780–0.7819 | 5 |
| 0.7820–0.7859 | 16 |
| 0.7860–0.7899 | 8 |
| 0.7900–0.7939 | 2 |
| Total | 36 |
c.
Explain whether there are any notable differences by comparing the frequency tables from parts (a) and (b).
Explanation of Solution
From the frequencies tables of parts (a) and (b) it can be observed that, the regular Pepsi weights are more than the diet Pepsi weights because of the sugar levels in the regular Pepsi. But the volumes of both type cans are approximately same.
Want to see more full solutions like this?
Chapter 3 Solutions
Pearson eText for Statistical Reasoning for Everyday Life -- Instant Access (Pearson+)
Additional Math Textbook Solutions
The Practice of Statistics for AP - 4th Edition
Introductory Statistics (10th Edition)
Essentials of Statistics (6th Edition)
Statistics: Informed Decisions Using Data (5th Edition)
Elementary Statistics Using the TI-83/84 Plus Calculator, Books a la Carte Edition (4th Edition)
Elementary Statistics: Picturing the World (7th Edition)


- Find the mean of the data from the frequency table: Value Frequency 0 6 1 0 2 6 3 8 4 9 5 6 Give your answer to two decimal places.arrow_forwardA keen angler kept a record of the weight of each of his last 51 catches of fish. The weights, recorded to the nearest 0-1 kg, are as given in the following table. Weight (kg) 0.0-0.4 0.5-0.9 1.0-1.2 1.3-1.7 1.8-2.1 2.2-3.7 3.8-5-2 Frequency 12 8 2 9 8 8 4 Draw a histogram for the data, and use it to calculate the modal class.arrow_forwardUse StatCrunch with the vehicle counts to the right observed during a survey of a student parking lot. Complete part A below. Category of vehicle Frequency American cars 28 Japanese cars 27 English cars 6 Other European cars 12 Motorcycles 7 a. Make a frequency table for the data. Include columns for relative and cumulative frequencies, and include a row at the bottom listing the totals for each column. Complete the frequency table below. Category of vehicle Frequency Relative Frequency Cumulative Frequency American cars 28 Japanese cars 27 English cars 6 Other European cars 12 Motorcycles 7 Totalarrow_forward
- Determine the skewness of the data below X Frequency 1 1 2 10 3 6 4 3arrow_forwardUse the following table to answer questions 6–9. Monthly Water Bills Jan Feb Mar Apr May June July Aug Sept Oct Nov Dec $40 $42 $40 $38 $48 $50 $58 $62 $56 $46 $44 $44 6. Write the formula for the mean water bill for the entire year using sigma notation and determine that mean. Round your answer to the nearest cent.arrow_forwardThe following data represent the scores (in words per minute) of 25 computer encoders on a speed test. Complete the table and answer the questions below. Scores Xm fXmarrow_forwardThe ungrouped frequency table below shows the number of students absent in a statistics class in a fall semester. (click to select) V a. Is it possible to recover the raw data from this table? Number Absent Number of Classes 3 3 5 8 0 1 2 3 4 5 6 b. What is the total number of absenteeism recorded in the course that semester? c. What number of absent students occurred most often? d. In how many classes were 2 students absent? 6 3 3 e. How many times were no more than 2 students absent? % Round to two decimal places f. How many times were more than 4 students absent? g. What proportion of classes were exactly 4 students absent? % Round to two decimal places h. What proportion of classes were up to 3 students absent? % i. What proportion of classes were more than 3 students absent?arrow_forward-Find the mode from the following data : Values Frequency Values Frequency Below 50 97 Below 30 60 Below 45 95 Below 25 30 Below 40 90 Below 20 12 Below 35 80 Below 15 4arrow_forwardIn California, they need more rain to sustain the health of the natural environment, state argriculture, and state economy. A group of statistics students in Oxnard College recorded the amount of rain during 2016-2017 school year, measuring the intensity by the inches of rain, and the results were: Daily Rain Amounts Inches of Rain 1 2 3 4 5 6 Frequency 7 6 6 3 2 1 The mean rain intensity: ________inches (Please show your answer to 1 decimal place.) The median rain intensity: _______inches The mode rain intensity: _______inches Please separate your answers by a comma if there is more than one mode.arrow_forwardof This frequency table depicts the average hours spent on social media use for students in PSY201 class. Hours Frequency 4 3.5 3 2.5 2 1.5 1 0.5 0 10 5 5 3 7 16 0 5 3 How many students spent at least 3 hours on social media in PSY201?arrow_forwardThe frequency table below shows the ages of the students in a psychology lecture hall. Complete the Relative Frequency column of the table. Do not round. Provide your answer below: Age Frequency Relative Frequency 17 9 18 18 0.15 19 27 20 30 0.25 21 21 0.175 22 15 0.125arrow_forwardFind the mean for the following frequency tables.arrow_forwardarrow_back_iosSEE MORE QUESTIONSarrow_forward_ios
 Holt Mcdougal Larson Pre-algebra: Student Edition...AlgebraISBN:9780547587776Author:HOLT MCDOUGALPublisher:HOLT MCDOUGAL