
OPERATIONS MANAGEMENT CUSTOM ACCESS
11th Edition
ISBN: 9780135622438
Author: KRAJEWSKI
Publisher: PEARSON EDUCATION (COLLEGE)
expand_more
expand_more
format_list_bulleted
Concept explainers
Question
Chapter 3, Problem 1P
Summary Introduction
To calculate:
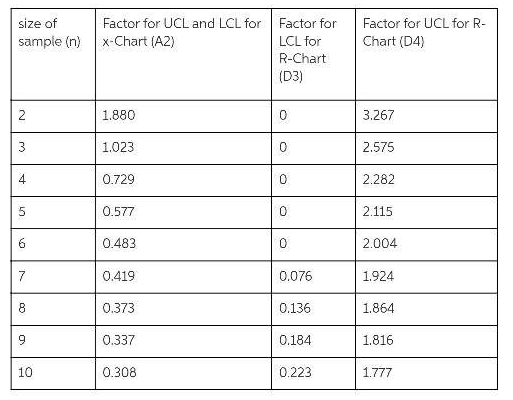
Use the table below,establish control limits for sample mean and ranges for the car wash process.
Expert Solution & Answer
Want to see the full answer?
Check out a sample textbook solution
Students have asked these similar questions
At Quick Car Wash, the wash process is advertised to take less than 6 minutes. Consequently, management has set a target average of 320 seconds for the wash process. Suppose the average range for a sample of 10 cars is 10 seconds. Use the accompanying table to establish control limits for sample means and ranges for the car wash process.
Checkout time at a supermarket is monitored using a mean and a range chart. Six samples of n = 20 observations have been obtained and the sample means and ranges computed:
Sample
Mean
Range
1
3.06
.42
2
3.15
.50
3
3.11
.41
4
3.13
.46
5
3.06
.46
6
3.09
.45
Using the factors in Table 10.3 , determine upper and lower limits for mean and range charts.
Is the process in control?
What is the significance of the order of observation in process control?
Chapter 3 Solutions
OPERATIONS MANAGEMENT CUSTOM ACCESS
Ch. 3 - Should a very pricey handcrafted object of beauty...Ch. 3 - Prob. 2DQCh. 3 - Prob. 3DQCh. 3 - Prob. 1PCh. 3 - Prob. 2PCh. 3 - Prob. 3PCh. 3 - Prob. 4PCh. 3 - Prob. 5PCh. 3 - Prob. 6PCh. 3 - Prob. 7P
Ch. 3 - Prob. 8PCh. 3 - Prob. 9PCh. 3 - Prob. 10PCh. 3 - Prob. 11PCh. 3 - Prob. 12PCh. 3 - Prob. 13PCh. 3 - Prob. 14PCh. 3 - Prob. 15PCh. 3 - Prob. 16PCh. 3 - Prob. 17PCh. 3 - Prob. 18PCh. 3 - Prob. 19PCh. 3 - Prob. 20PCh. 3 - Prob. 21PCh. 3 - Prob. 26PCh. 3 - Prob. 27PCh. 3 - Prob. 28PCh. 3 - Prob. 29PCh. 3 - Prob. 31PCh. 3 - Prob. 1AMECh. 3 - Prob. 2AMECh. 3 - Prob. 3AMECh. 3 - Prob. 4AMECh. 3 - Prob. 5AMECh. 3 - Prob. 1VCCh. 3 - Prob. 2VC
Knowledge Booster


Learn more about
Need a deep-dive on the concept behind this application? Look no further. Learn more about this topic, operations-management and related others by exploring similar questions and additional content below.Similar questions
- Why is it important to prove that a process is proven capable before developing statistical control limits (i.e., SPC charts)?arrow_forwardWhat is it important to prove that a process is proven capable before developing statistical control limit ?arrow_forwardWhy is order of observation important in process control?arrow_forward
- At Quick Car Wash, the wash process is advertised to take less than 7 minutes. Consequently, management has set a target average of 390 seconds for the wash process. Suppose the average range for a sample of 10 cars is 11 seconds. Use the accompanying table to establish control limits for sample means and ranges for the car wash process. The UCL Subscript x overbar equals seconds and the LCL Subscript x overbar equals seconds. (Enter your responses rounded to two decimal places.)arrow_forwardExplain why is order of observation important in process control ?arrow_forwardAt Quick Car Wash, the wash process is advertised to take less than 7 minutes. Consequently, management has set a target average of 390 seconds for the wash process. Suppose the average range for a sample of 10 cars is 11 seconds. Part 2 The UCL Subscript Upper R equals seconds and the LCL Subscript Upper R equals seconds. (Enter your responses rounded to two decimal places.)arrow_forward
- In a fabric manufacturing factory, the quality control process using control charts from SPC. In an hour there are a total of 5 samples are taken each having 4 observations regarding the thickness of fabric in measured in millimeters. In a particular hour, the sample means (X-bar) are noted to be: 172.11, 219.58, 208.24, 112.44, and 123.30 respectively. In the same sample, the corresponding ranges are: 13.17, 13.38, 15.34, 13.04, and 13.02 respectively What are the lower and upper control limits for the X-bar chart? O a. None is correct O b. 143.55, 165.47 Oc. 144.78, 159.11 O d. 157.21, 177.05 O e. 146.01, 157.87 Of. 142.92, 160.66arrow_forwardIn a fabric manufacturing factory, the quality control process using control charts from SPC. In an hour there are a total of 5 samples are taken each having 4 observations regarding the thickness of fabric in measured in millimeters. In a particular hour, the sample means (X-bar) are noted to be: 172.11,219.58, 208.24, 112.44, and 123.30 respectively. In the same sample, the corresponding ranges are: 13.17, 13.38, 15.34, 13.04, and 13.02 respectively What are the lower and upper control limits for the R chart? O a. 0,31.47 O b. 0,30.99 Oc. None is correct O d. 0,29.17 O e. 0,31.17 O f. 0,28.17arrow_forwardIn process industry during a daily production run, a total of five (05) samples are collected with four (04) observations within each sample. The sample means (X-bar) are; 14.09, 13.94,16.86, 20.00, and 16.64 respectively. The corresponding ranges are; 9.90, 7.73, 4.41, 7.56, and 3.49 respectively. The lower and upper control limits of the x-bar chart are respectively O a. 11.44, 20.66 O b. 11.29, 20.65 C. None is correct Od. 11.47, 21.14 e. 11.47, 16.55arrow_forward
- When most processes are sampled for control chart purposes, why aren't they in statistical control?arrow_forwardIn a fabric manufacturing factory, the quality control process using control charts from SPC. In an hour there are a total of 5 samples are taken each having 5 observations regarding the thickness of fabric in measured in millimeters In a particular hour, the sample means (X-bar) are noted to be: 172.11, 219.58, 208.24, 112.44, and 123.30 respectively. In the same sample, the corresponding ranges are: 13.17, 3.38, 15.34, 13.0 , and 13.02 respectively What are the lower and upper control limits for the X-bar chart? a . 157.21 , 177.05 b. 146.01, 157.87 c. 159.25, 175.02 d. 142.92, 160.66 e. 143.55, 165.47 f. None is correctarrow_forwardIn a fabric manufacturing factory, the quality control process using control charts from SPC. In an hour there are a total of 5 samples are taken each having 6 observations regarding the thickness of fabric in measured in millimeters. In a particular hour, the sample means (X-bar) are noted to be: 156.46, 199.62, 189.31, 102.22, and112.09 respectively. In the same sample, the corresponding ranges are: 11.97, 12.17, 13.94, 11.86, and 11.83 respectively. What are the lower and upper control limits for the X-bar chart? O a. None is correct O b. 146.01, 157.87 Oc. 142.92, 160.66 Od. 143.55, 165.47 Oe. 156.55, 170.47 Of. 144.78, 159.11arrow_forward
arrow_back_ios
SEE MORE QUESTIONS
arrow_forward_ios
Recommended textbooks for you
 Practical Management ScienceOperations ManagementISBN:9781337406659Author:WINSTON, Wayne L.Publisher:Cengage,
 Operations ManagementOperations ManagementISBN:9781259667473Author:William J StevensonPublisher:McGraw-Hill Education
 Operations and Supply Chain Management (Mcgraw-hi...Operations ManagementISBN:9781259666100Author:F. Robert Jacobs, Richard B ChasePublisher:McGraw-Hill Education
 Purchasing and Supply Chain ManagementOperations ManagementISBN:9781285869681Author:Robert M. Monczka, Robert B. Handfield, Larry C. Giunipero, James L. PattersonPublisher:Cengage Learning
 Production and Operations Analysis, Seventh Editi...Operations ManagementISBN:9781478623069Author:Steven Nahmias, Tava Lennon OlsenPublisher:Waveland Press, Inc.
Practical Management Science
Operations Management
ISBN:9781337406659
Author:WINSTON, Wayne L.
Publisher:Cengage,
Operations Management
Operations Management
ISBN:9781259667473
Author:William J Stevenson
Publisher:McGraw-Hill Education
Operations and Supply Chain Management (Mcgraw-hi...
Operations Management
ISBN:9781259666100
Author:F. Robert Jacobs, Richard B Chase
Publisher:McGraw-Hill Education
Purchasing and Supply Chain Management
Operations Management
ISBN:9781285869681
Author:Robert M. Monczka, Robert B. Handfield, Larry C. Giunipero, James L. Patterson
Publisher:Cengage Learning
Production and Operations Analysis, Seventh Editi...
Operations Management
ISBN:9781478623069
Author:Steven Nahmias, Tava Lennon Olsen
Publisher:Waveland Press, Inc.