28. Bono Length Research performed at NASA, led by Dr. Emily R. Morey-Holton, measured the lengths of the right humerus and right tibia in 11 rats that were sent to space on Spacelab Life Sciences 2. The following data were collected. (a) Draw a scatter diagram of the data treating length of the right humerus as the independent variable. (b) Based on the scatter diagram, do you think that there is a linear relation between the length of the right humerus and the length of the right tibia? (c) Use a graphing utility to find the line of best fit relating length of the right humerus and length of the right tibia. (d) Predict the length of the right tibia on a rat whose right humerus is 26.5 millimeters (mm).
28. Bono Length Research performed at NASA, led by Dr. Emily R. Morey-Holton, measured the lengths of the right humerus and right tibia in 11 rats that were sent to space on Spacelab Life Sciences 2. The following data were collected. (a) Draw a scatter diagram of the data treating length of the right humerus as the independent variable. (b) Based on the scatter diagram, do you think that there is a linear relation between the length of the right humerus and the length of the right tibia? (c) Use a graphing utility to find the line of best fit relating length of the right humerus and length of the right tibia. (d) Predict the length of the right tibia on a rat whose right humerus is 26.5 millimeters (mm).
Solution Summary: The author explains that the scatter diagram is not linear, but a polynomial relation.
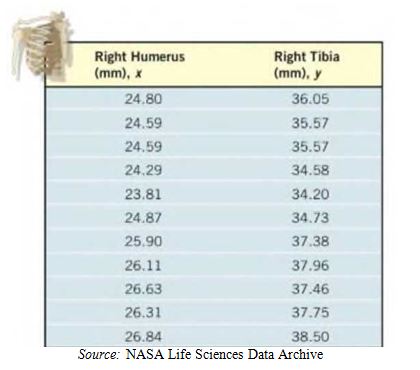
28. Bono Length Research performed at NASA, led by Dr. Emily R. Morey-Holton, measured the lengths of the right humerus and right tibia in 11 rats that were sent to space on Spacelab Life Sciences 2. The following data were collected.
(a) Draw a scatter diagram of the data treating length of the right humerus as the independent variable.
(b) Based on the scatter diagram, do you think that there is a linear relation between the length of the right humerus and the length of the right tibia?
(c) Use a graphing utility to find the line of best fit relating length of the right humerus and length of the right tibia.
(d) Predict the length of the right tibia on a rat whose right humerus is 26.5 millimeters (mm).
Definition Definition Representation of the direction and degree of correlation in graphical form. The grouping of points that are plotted makes it a scatter diagram. A line can be drawn showing the relationship based on the direction of points and their distance from each other.
Need a deep-dive on the concept behind this application? Look no further. Learn more about this topic, calculus and related others by exploring similar questions and additional content below.
Hypothesis Testing using Confidence Interval Approach; Author: BUM2413 Applied Statistics UMP;https://www.youtube.com/watch?v=Hq1l3e9pLyY;License: Standard YouTube License, CC-BY
Hypothesis Testing - Difference of Two Means - Student's -Distribution & Normal Distribution; Author: The Organic Chemistry Tutor;https://www.youtube.com/watch?v=UcZwyzwWU7o;License: Standard Youtube License


 Glencoe Algebra 1, Student Edition, 9780079039897...AlgebraISBN:9780079039897Author:CarterPublisher:McGraw Hill
 Big Ideas Math A Bridge To Success Algebra 1: Stu...AlgebraISBN:9781680331141Author:HOUGHTON MIFFLIN HARCOURTPublisher:Houghton Mifflin Harcourt