
Subparts (a):
The quantity supplied.
Given information:
Figure 1 shows the Supply curve ‘S1’ for tennis balls:

Table -1 shows the quantity supplied (S1 and S2) and its changes:
|
‘S1’ Quantity supplied | ‘S2’ Quantity supplied | Change in quantity supplied | |
| 3 | - | 4 | - |
| 2 | - | 2 | - |
| 1 | - | 0 | - |
Subparts (b):
The quantity supplied.
Given information:
Figure 1 shows the Supply curve ‘S1’ for tennis balls:
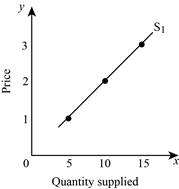
Table -1 shows the quantity supplied (S1 and S2) and its changes:
| Price |
‘S1’ Quantity supplied | ‘S2’ Quantity supplied | Change in quantity supplied |
| 3 | - | 4 | - |
| 2 | - | 2 | - |
| 1 | - | 0 | - |
Subparts (c):
The quantity supplied.
Given information:
Figure 1 shows the Supply curve ‘S1’ for tennis balls:

Table -1 shows the quantity supplied (S1 and S2) and its changes:
| Price |
‘S1’ Quantity supplied | ‘S2’ Quantity supplied | Change in quantity supplied |
| 3 | - | 4 | - |
| 2 | - | 2 | - |
| 1 | - | 0 | - |
Subparts (d):
The quantity supplied.
Given information:
Figure 1 shows the Supply curve ‘S1’ for tennis balls:
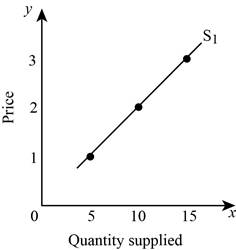
Table -1 shows the quantity supplied (S1 and S2) and its changes:
| Price |
‘S1’ Quantity supplied | ‘S2’ Quantity supplied | Change in quantity supplied |
| 3 | - | 4 | - |
| 2 | - | 2 | - |
| 1 | - | 0 | - |
Want to see the full answer?
Check out a sample textbook solution
Chapter 3 Solutions
Microeconomics: Principles, Problems, & Policies (McGraw-Hill Series in Economics)

- ADVANCED ANALYSIS Assume that demand for a commodity is represented by the equation P=20−2Qd.P=20−2Qd.Supply is represented by the equation P=−5+3Qs,P=−5+3Qs,where Qd and Qs are quantity demanded and quantity supplied, respectively, and P is price.Instructions: Round your answer for price to 2 decimal places and enter your answer for quantity as a whole number. Using the equilibrium condition Qs = Qd, solve the equations to determine equilibrium price and equilibrium quantity. Equilibrium price = ? $ Equilibrium quantity = ? unitsarrow_forwardADVANCED ANALYSIS Assume that demand for a commodity is represented by the equation P=80−2Qd.P=80−2Qd. Supply is represented by the equation P=−20+2Qs,P=−20+2Qs, where Qd and Qs are quantity demanded and quantity supplied, respectively, and P is price.Instructions: Round your answer for price to 2 decimal places and enter your answer for quantity as a whole number. Using the equilibrium condition Qs = Qd, solve the equations to determine equilibrium price and equilibrium quantity.arrow_forwardSuppose the total demand for wheat and the total supply of wheat per month in the Kansas City grain market are as shown. Suppose that the government establishes a price ceiling of $3.70 for wheat. What might prompt the government to establish this price ceiling? Explain carefully the main effects. Demonstrate your answer graphically. Next, suppose that the government establishes a price floor of $4.60 for wheat. What will be the main effects of this price floor? Demonstrate your answer graphically.arrow_forward
- The total demand for Cement and the total supply of Cement per month in the UAE construction market are as shown in the table below: a) Suppose that the government establishes a price ceiling of Dh 295 per ton for ,Cement. What might prompt the government to establish this price ceiling? Explain carefully the main effects. Demonstrate your answer graphically. b) Next, suppose that the government establishes a price floor of Dh 320 per ton for Cement. What will be the main effects of this price floor? Demonstrate your answer graphically. c) Read the article below that published in Khaleej Times and state who sets the price ceiling in UAE? Also comment briefly on the cement prices in 2008 as compared to present cement prices? and comment if price ceiling action by the Government was / is effective.arrow_forward3. Suppose that annual demand in the U.S. market for ice cream cones can be expressed as QD = 800 + .2I - 100P, where QD is the number of cones demanded in millions of cones, I equals average monthly income in dollars, and P is price in dollars per cone. Supply can be expressed as QS = 200 + 150P (with the same units for quantity and price). A. Graph the demand and supply curves for ice cream cones, assuming that average monthly income is $2,000, and solve for the equilibrium price and quantity. B. Now assume that average monthly income drops to $750 and supply is unchanged. Draw the new demand curve on the same graph as used in (a) above and solve for the new equilibrium price and quantity. How would you describe the shift in demand intuitivelyarrow_forwardplease show work Suppose there is a decrease in the hourly wages of farm workers in Ontario who harvest blueberries. This Select one: O A. shifts the supply curve of blueberries rightward. B. shifts the demand curve for blueberries rightward . O C. shifts the demand curve for blueberries leftward. O D. shifts the supply curve of blueberries leftward. O E. decreases the quantity supplied of blueberries.arrow_forward
- What will happen if the price were below the equilibrium price? Select one: O a. Quantity demanded would exceed quantity supplied and there would be a surplus O b. Quantity demanded would exceed quantity supplied and there would be a shortage O c. Quantity supplied would exceed quantity demanded and there would be a surplus O d. Quantity supplied would exceed quantity demanded and there would be a shortage Oe. Quantity supplied would equal quantity demanded and the market would cleararrow_forwardAssume that both the demand curve and the supply curve for coffee shift to the right but the demand curve shifts more than the supply curve. As a result O the equilibrium price of coffee will decrease; the equilibrium quantity may increase or decrease. O the equilibrium price of coffee may increase or decrease; the equilibrium quantity will increase. O both the equilibrium price and quantity of coffee will increase. O the equilibrium price of coffee will increase; the equilibrium quantity may increase or decrease.arrow_forwardSuppose that the price elasticity of demand for world famous Bi told that following a price increase, the quantity demanded fell b brought about this change in quantity demanded? O a. 40 percent O b. 25 percent O c. 2.5 percent O d. 0.4 percentarrow_forward
- Suppose demand and supply are given by: (LO3, LO4)Qx d = 14 − 1/2 Px and Qx s = 1/4Px − 1a. Determine the equilibrium price and quantity. Show the equilibrium graphically.arrow_forwardConsider that the new more eco-friendly coal briquettes for heating stove fire costs 3,750₮ per bag of 25kg. Yet the same amount of raw unprocessed coal costs 2,000₮ for about the same 25kg bag. As you can imagine people will keep buying the cheaper raw coal for the winter cold months. a. Please draw side-by side the supply and demand diagrams of a Raw coal and New processed coal bags. Mark all the necessary points and units that we normally mark. b. What kind of an externality would you say this RAW coal has and how would it impact the bystanders?c. We can't precisely measure the cost of the actual externality from raw coal, but we can almost certainly assume that at least the amount of price difference is the externality cost. What would you recommend the government do to improve the situation? Show it on the graph and mark to clearly suggest your solution.arrow_forwardA supply-demand graph can be described as having a demand curve that begins in the upper left and slopes downward to the lower right; and having a supply curve that begins in the lower left and slopes upward to the upper right. Using words in a narrative, please describe and explain how both the equilibrium price and quantity will change when: d) Only demand decreasesarrow_forward
 Microeconomics: Principles & PolicyEconomicsISBN:9781337794992Author:William J. Baumol, Alan S. Blinder, John L. SolowPublisher:Cengage Learning