
Concept explainers
a
To prove:
Graphical representation of utility function whether IC curve is convex or not.
a
Explanation of Solution
The utility function is linear. This means that the goods x and y are perfect substitutes. For simplicity, the value of utility is taken to be constant at 60. Then the equation for the indifference curve becomes:
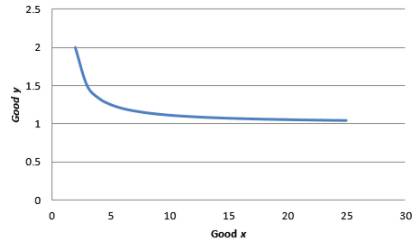
To graph the indifference curve:
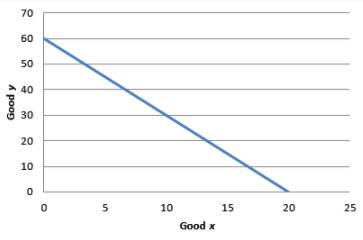
Graph 1
The MRS is constant at 3. Hence, the IC curve is not convex.
Introduction:
Rate of substitution is the ratio of two goods at which consumer gives away a quantity of good 1 in order to get good 2
b)
To prove:
Graphical representation of utility function whether IC curve is convex or not.
b)
Explanation of Solution
Let utility function be set equal to 10.
Then the equation will be:
The IC for utility equal to 10 can be obtained by graphing the following equation:
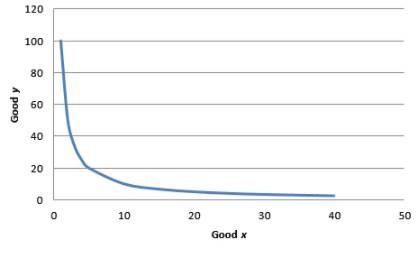
Graph 2
For equation,
As x is in the denominator, the MRS decreases when x increases. Hence indifference curve is convex.
Introduction:
Rate of substitution is the ratio of two goods at which consumer gives away a quantity of good 1 in order to get good 2
c)
To prove:
Graphical representation of utility function whether IC curve is convex or not.
c)
Explanation of Solution
To simplify the function, arbitrarily set the utility at 8. So, the utility function becomes
Graphical representation:
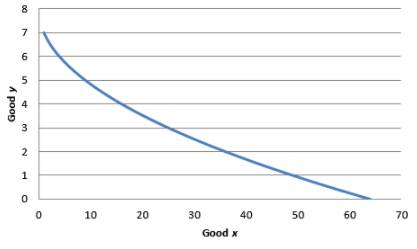
Graph 3
As x is in the denominator, the MRS decreases when x increases. Hence indifference curve is convex.
Introduction:
Rate of substitution is the ratio of two goods at which consumer gives away a quantity of good 1 in order to get good 2
d)
To prove:
Graphical representation of utility function whether IC curve is convex or not.
d)
Explanation of Solution
Utility is set equal to 4. Then the equation for equation is:
The indifference curve for utility equal to 4:
The graph is shown below:
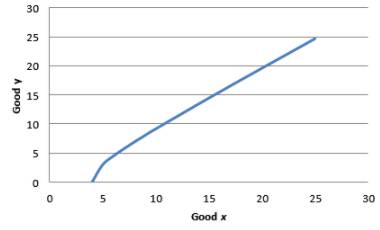
Graph 4
In the above equation, x is numerator. Though there is a negative sign in front of the fraction. This means that as x increases, the marginal rate of substitution increases.
Hence, the indifference curves are not convex.
Introduction:
Rate of substitution is the ratio of two goods at which consumer gives away a quantity of good 1 in order to get good 2
e)
To prove:
Graphical representation of utility function whether IC curve is convex or not.
e)
Explanation of Solution
To simplify the problem, we arbitrarily take utility equal to 1.
To graph the indifference curve,
Graph 5
MRS =
In the above equation, x is in numerator. Hence, as x increases the marginal rate of substitution decreases. Hence, the indifference curves are convex.
Introduction:
Rate of substitution is the ratio of two goods at which consumer gives away a quantity of good 1 in order to get good 2
Want to see more full solutions like this?
Chapter 3 Solutions
Bundle: Microeconomic Theory: Basic Principles and Extensions, 12th + MindTap Economics, 1 term (6 months) Printed Access Card


 Microeconomics: Principles & PolicyEconomicsISBN:9781337794992Author:William J. Baumol, Alan S. Blinder, John L. SolowPublisher:Cengage Learning
 Economics (MindTap Course List)EconomicsISBN:9781337617383Author:Roger A. ArnoldPublisher:Cengage Learning