Elementary Statistics: A Step By Step Approach
10th Edition
ISBN: 9781259755330
Author: Allan G. Bluman
Publisher: McGraw-Hill Education
bartleby

Concept explainers

bartleby

Videos

Textbook Question
Book Icon
Chapter 3, Problem 3.3.23RE

The number of police calls a small police department received each month is shown in the frequency distribution.

Class limits Frequency
39.9–42.8 2
42.9–45.8 2
45.9–48.8 5
48.9–51.8 5
51.9–54.8 12
54.9–57.8 3

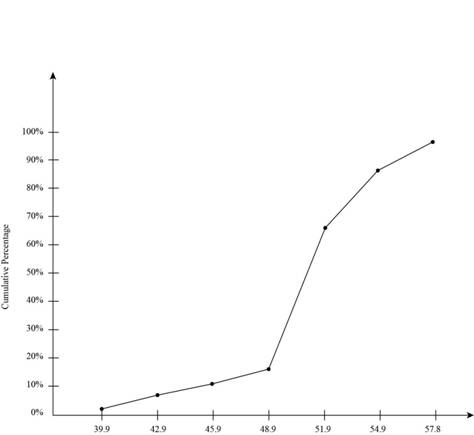
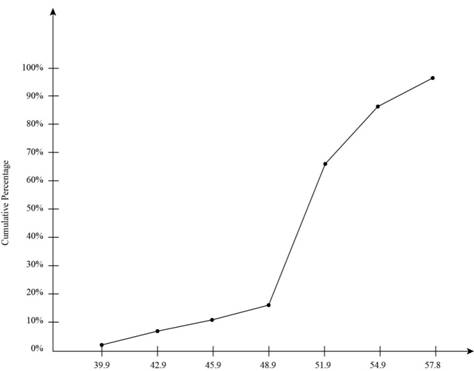
a. Construct a percentile graph.

b. Find the values that correspond to the 35th, 65th, and 85th percentiles.

c. Find the percentile of values 44, 48, and 54.

a.

Expert Solution
Check Mark
To determine

To construct: A percentile graph for the given data.

Answer to Problem 3.3.23RE

Percentile graph is shown below.

Elementary Statistics: A Step By Step Approach, Chapter 3, Problem 3.3.23RE , additional homework tip  1

Explanation of Solution

Given info:

Class limit Frequency
39.9-42.8 2
42.8-45.8 2
45.9-48.8 5
48.9-51.8 5
51.9-54.8 12
54.9-57.8 3

Calculation:

Make a table for calculating percentile graph is shown below,

A

Class limit

B

Frequency

C

Cumulative frequency

D

Cumulative percent


Determine cumulative frequency and place in column C.

Determine the cumulative percentage and place in column D.

Cumulative%=cumulativefrequencyn×100%

Put 2 for cumulative frequency and 29 for n in the above formula to calculate the cumulative percentage for first class.

Cumulative%=229×100%=6.89%

Put 4 for cumulative frequency and 29 for n in the above formula to calculate the cumulative percentage for second class.

Cumulative%=429×100%=13.79%

Put 9 for cumulative frequency and 29 for n in the above formula to calculate the cumulative percentage for third class.

Cumulative%=929×100%=31.03%

Put 14 for cumulative frequency and 29 for n in the above formula to calculate the cumulative percentage for fourth class.

Cumulative%=1429×100%=73.68%

Put 26 for cumulative frequency and 29 for n in the above formula to calculate the cumulative percentage for fifth class.

Cumulative%=2629×100%=89.65%

Thus, the table for calculating percentile graph is,

A

Class limit

B

Frequency

C

Cumulative frequency

D

Cumulative percent

39.9-42.8 2 2 6.89
42.9-45.8 2 4 13.79
45.9-48.8 5 9 31.03
48.9-51.8 5 14 73.68
51.9-54.8 12 26 89.65
54.9-57.8 3 29 100

Graph the data using class boundaries for the x axis and the percentage for the y axis. Plot the cumulative percent and join the lines. Thus, the percentile graph is obtained as shown below.

Elementary Statistics: A Step By Step Approach, Chapter 3, Problem 3.3.23RE , additional homework tip  2

b.

Expert Solution
Check Mark
To determine

The values that correspond to the 35th, 65th and 85th percentiles.

Answer to Problem 3.3.23RE

The percentile values corresponding to 35th, 65th and 85th are 50, 53 and 55.

Explanation of Solution

Calculation:

Formula to calculate the percentile for the grouped data is given below,

Pm=l+hf(m.n100c)

Where,

  • l is the lower boundary of the class of the mth percentile.
  • h is the width of the class.
  • f is frequency of the class.
  • n is the total number of the frequencies.

Table for calculating percentile value,

A

Class limit

B

Frequency

C

Cumulative frequency

D

Cumulative percent

39.9-42.8 2 2 6.89
42.9-45.8 2 4 13.79
45.9-48.8 5 9 31.03
48.9-51.8 5 14 73.68
51.9-54.8 12 26 89.65
54.9-57.8 3 29 100

Locate the 35th percentiles by 35×29100=10.12 . So 35th percentiles lies in the interval 48.9 and 51.8.

Substitute 35 for m, 48.9 for l , 3 for h , 5 for f , 29 for n and 9 for c in the above formula,

P35=48.9+35(35×291009)=48.9+35(10.129)=48.9+0.672=49.57

Thus, the 35th percentile of the data is approximately 50.

Locate the 65th percentiles by 65×29100=18.85 . So 65th percentiles lies in the interval 51.9 and 54.8.

Substitute 65 for m, 51.9 for l , 3 for h , 12 for f , 29 for n and 14 for c in the above formula,

P65=51.9+312(65×2910014)=51.9+312(18.8514)=51.9+1.21=53.11

Thus, the 65th percentile of the data is approximately 53.

Locate the 85th percentiles by 85×29100=24.65 . So 85th percentiles lies in the interval 51.9 and 54.8.

Substitute 85 for m, 51.9 for l , 3 for h , 12 for f , 29 for n and 14 for c in the above formula,

P85=51.9+312(85×2910014)=51.9+312(24.6514)=51.9+2.66=54.56

Thus, the 85th percentile of the data is approximately 55.

c.

Expert Solution
Check Mark
To determine

The percentile rank of values 44, 48 and 54.

Answer to Problem 3.3.23RE

The percentile rank for values 44, 48 and 54 are 9th, 26th and 77th respectively.

Explanation of Solution

Calculation:

Formula to calculate the percentile rank for the grouped data is given below,

Pm=l+hf(m.n100c)

Where,

  • l is the lower boundary of the class of the mth percentile.
  • h is the width of the class.
  • f is frequency of the class.
  • n is the total number of the frequencies.
  • c is the cumulative frequency of the class immediate preceding to the class.

Value 44 lies in the interval 42.9-45.8.

Substitute 44 for Pm , 42.9 for l , 3 for h , 2 for f , 29 for n and 2 for c in the above formula,

44=42.9+32(m×291002)=42.9+1.5(0.29m2)=42.9+0.44m3=39.9+0.44m

Simplify the equation,

0.44m=4439.9m=4.10.44=9.31=9

Thus, the percentile rank of the value 44 is 9th percentile.

The value 48 lies in the interval 48.9-51.8.

Substitute 48 for Pm , 48.9 for l , 3 for h , 5 for f , 29 for n and 9 for c in the above formula,

48=48.9+35(m×291009)=48.9+0.6(0.29m9)=48.9+0.174m5.4=43.5+0.174m

Simplify the equation,

0.174m=4843.5m=4.50.174=25.86=26

Thus, the percentile rank of the value 48 is 26th percentile.

The value 54 lies in the interval 51.9-54.8.

Substitute 54 for Pm 51.9 for l , 3 for h , 12 for f , 29 for n and 14 for c in the above formula,

54=51.9+312(m×2910014)=51.9+312(0.29m14)=51.9+0.0725m3.5=48.4+0.0725m

Simplify the equation,

0.0725m=5448.4m=5.60.0725=77.2477

Thus, the percentile rank of the value 54 is 77th percentile.

Want to see more full solutions like this?

Subscribe now to access step-by-step solutions to millions of textbook problems written by subject matter experts!

Chapter 3 Solutions

Elementary Statistics: A Step By Step Approach

Ch. 3.1 - Foreign Workers The number of foreign workers...Ch. 3.1 - Distances of Stars Of the 25 brightest stars, the...Ch. 3.1 - Contest Spelling Words The last words given and...Ch. 3.1 - Wind Speeds The data show the maximum wind speeds...Ch. 3.1 - Hourly Compensation for Production Workers The...Ch. 3.1 - Points in Rose Bowl Games The data show the number...Ch. 3.1 - Percentage of Foreign-Born People The percentage...Ch. 3.1 - Percentage of College-Educated Population over 25...Ch. 3.1 - Net Worth of Corporations These data represent the...Ch. 3.1 - Specialty Coffee Shops A random sample of 30...Ch. 3.1 - Commissions Earned This frequency distribution...Ch. 3.1 - Children of U.S. Presidents The data show the...Ch. 3.1 - Enrollments for Selected Independent Religiously...Ch. 3.1 - Automobile Selling Prices Find the weighted mean...Ch. 3.1 - Fat Grams Using the weighted mean, find the...Ch. 3.1 - Diet Cola Preference A recent survey of a new diet...Ch. 3.1 - Costs of Helicopters The costs of three models of...Ch. 3.1 - Final Grade An instructor grades exams, 20%; term...Ch. 3.1 - Final Grade Another instructor gives four 1-hour...Ch. 3.1 - For these situations, state which measure of...Ch. 3.1 - Describe which measure of central tendencymean,...Ch. 3.1 - What types of symbols are used to represent sample...Ch. 3.1 - A local fast-food company claims that the average...Ch. 3.1 - If the mean of five values is 64, find the sum of...Ch. 3.1 - If the mean of five values is 8.2 and four of the...Ch. 3.1 - Find the mean of 10, 20, 30, 40, and 50. a. Add 10...Ch. 3.1 - Harmonic Mean The harmonic mean (HM) is defined as...Ch. 3.1 - Geometric Mean The geometric mean (GM) is defined...Ch. 3.1 - Quadratic Mean A useful mean in the physical...Ch. 3.1 - Median for Grouped Data An approximate median can...Ch. 3.2 - Blood Pressure The table lists means and standard...Ch. 3.2 - What is the relationship between the variance and...Ch. 3.2 - Why might the range not be the best estimate of...Ch. 3.2 - What are the symbols used to represent the...Ch. 3.2 - What are the symbols used to represent the sample...Ch. 3.2 - Why is the unbiased estimator of variance used?Ch. 3.2 - The three data sets have the same mean and range,...Ch. 3.2 - Traveler Spending The data show the traveler...Ch. 3.2 - Cigarette Taxes The increases (in cents) in...Ch. 3.2 - Prob. 9ECh. 3.2 - Size of U.S. States The total surface area (in...Ch. 3.2 - Multiple Births The numbers of various multiple...Ch. 3.2 - Starting Teachers Salaries Starting teachers...Ch. 3.2 - Ages of U.S. Astronaut Candidates The average age...Ch. 3.2 - Times Spent in Rush-Hour Traffic A sample of 12...Ch. 3.2 - Laws Passed The data show the number of public...Ch. 3.2 - Passenger Vehicle Deaths The number of people...Ch. 3.2 - Annual Precipitation Days The number of annual...Ch. 3.2 - Use the data from Exercises 7, 15, and 17...Ch. 3.2 - Pupils Per Teacher The following frequency...Ch. 3.2 - Automotive Fuel Efficiency Thirty automobiles were...Ch. 3.2 - Murders in Cities The data show the number of...Ch. 3.2 - Reaction Times In a study of reaction times to a...Ch. 3.2 - FM Radio Stations A random sample of 30 states...Ch. 3.2 - Murder Rates The data represent the murder rate...Ch. 3.2 - Waterfall Heights The frequency distribution shows...Ch. 3.2 - Baseball Team Batting Averages Team batting...Ch. 3.2 - Missing Work The average number of days that...Ch. 3.2 - Suspension Bridges The lengths (in feet) of the...Ch. 3.2 - Hospital Emergency Waiting Times The mean of the...Ch. 3.2 - Ages of Accountants The average age of the...Ch. 3.2 - Using Chebyshevs theorem, solve these problems for...Ch. 3.2 - The mean of a distribution is 20 and the standard...Ch. 3.2 - In a distribution of 160 values with a mean of 72,...Ch. 3.2 - Calories in Bagels The average number of calories...Ch. 3.2 - Time Spent Online Americans spend an average of 3...Ch. 3.2 - Solid Waste Production The average college student...Ch. 3.2 - Sale Price of Homes The average sale price of...Ch. 3.2 - Trials to Learn a Maze The average of the number...Ch. 3.2 - Farm Sizes The average farm in the United States...Ch. 3.2 - Citrus Fruit Consumption The average U.S. yearly...Ch. 3.2 - SAT Scores The national average for mathematics...Ch. 3.2 - Work Hours for College Faculty The average...Ch. 3.2 - Prices of Musical Instruments The average price of...Ch. 3.2 - Hours of Employment The mean and standard...Ch. 3.2 - Prob. 45ECh. 3.2 - Bonuses The mean and standard deviation of the...Ch. 3.2 - Serum Cholesterol Levels For this data set, find...Ch. 3.2 - Ages of Consumers For this data set, find the mean...Ch. 3.2 - Prob. 49ECCh. 3.2 - Use this data set: 10, 20, 30, 40, 50 a. Find the...Ch. 3.2 - Mean Deviation The mean deviation is found by...Ch. 3.2 - Pearson Coefficient of Skewness A measure to...Ch. 3.2 - All values of a data set must be within sn1 of the...Ch. 3.3 - Determining Dosages In an attempt to determine...Ch. 3.3 - What is a z score?Ch. 3.3 - Define percentile rank.Ch. 3.3 - What is the difference between a percentage and a...Ch. 3.3 - Define quartile.Ch. 3.3 - What is the relationship between quartiles and...Ch. 3.3 - What is a decile?Ch. 3.3 - How are deciles related to percentiles?Ch. 3.3 - To which percentile, quartile, and decile does the...Ch. 3.3 - Vacation Days If the average number of vacation...Ch. 3.3 - Age of Senators The average age of Senators in the...Ch. 3.3 - Marriage Age for Females The mean age at which...Ch. 3.3 - Teachers Salary The average teachers salary in a...Ch. 3.3 - Test Scores Which is a better relative position, a...Ch. 3.3 - College and University Debt A student graduated...Ch. 3.3 - Annual Miles Driven The average miles driven...Ch. 3.3 - Which score indicates the highest relative...Ch. 3.3 - The data show the population (in thousands) for a...Ch. 3.3 - College Room and Board Costs Room and board costs...Ch. 3.3 - Achievement Test Scores The data shown represent...Ch. 3.3 - Airplane Speeds The airborne speeds in miles per...Ch. 3.3 - Average Weekly Earnings The average weekly...Ch. 3.3 - Test Scores Find the percentile rank for each test...Ch. 3.3 - Hurricane Damage Find the percentile rank for each...Ch. 3.3 - Test Scores Find the percentile rank for each test...Ch. 3.3 - Taxes The data for a recent year show the taxes...Ch. 3.3 - Medical Marijuana 2015 Sales Tax: The data show...Ch. 3.3 - Gold Reserves The data show the gold reserves for...Ch. 3.3 - Police Calls in Schools The number of incidents in...Ch. 3.3 - Check each data set for outliers. a. 46, 28, 32,...Ch. 3.3 - Check each data set for outliers. a. 88, 72, 97,...Ch. 3.3 - Another measure of the average is called the...Ch. 3.3 - An employment evaluation exam has a variance of...Ch. 3.3 - A particular standardized test has scores that...Ch. 3.4 - Applying the Concepts 34 The Noisy Workplace...Ch. 3.4 - For Exercises 16, identify the five-number summary...Ch. 3.4 - For Exercises 16, identify the five-number summary...Ch. 3.4 - For Exercises 16, identify the five-number summary...Ch. 3.4 - For Exercises 16, identify the five-number summary...Ch. 3.4 - For Exercises 16, identify the five-number summary...Ch. 3.4 - For Exercises 16, identify the five-number summary...Ch. 3.4 - For Exercises 710, use each boxplot to identify...Ch. 3.4 - For Exercises 710, use each boxplot to identify...Ch. 3.4 - For Exercises 710, use each boxplot to identify...Ch. 3.4 - For Exercises 7-10. use each boxplot to identify-...Ch. 3.4 - School Graduation Rates The data show a sample of...Ch. 3.4 - Innings Pitched Construct a boxplot for the...Ch. 3.4 - Population of Colonies The data show the...Ch. 3.4 - Visitors Who Travel to Foreign Countries Construct...Ch. 3.4 - Areas of Islands The data show the sizes in square...Ch. 3.4 - Size of Dams These data represent the volumes in...Ch. 3.4 - Largest Dams The data show the heights (in feet)...Ch. 3.4 - Number of Tornadoes A four-month record for the...Ch. 3.4 - Unhealthy Smog Days A modified boxplot can be...Ch. 3 - Bank Failures The data show the number of bank...Ch. 3 - Shark Attacks The number of shark attacks and...Ch. 3 - AID: 1825 | 29/05/2018 3. Systolic Blood Pressure...Ch. 3 - SAT Scores The mean SAT math scores for selected...Ch. 3 - Households of Four Television Networks A survey...Ch. 3 - Investment Earnings An investor calculated these...Ch. 3 - Confirmed Measles Cases The data show a sample of...Ch. 3 - Tallest Buildings The number of stories in the 13...Ch. 3 - Rise in Tides Shown here is a frequency...Ch. 3 - Fuel Capacity The fuel capacity in gallons for...Ch. 3 - If the range of a data set is 24, find the...Ch. 3 - If the range of a data set is 56, find the...Ch. 3 - Textbooks in Professors Offices If the average...Ch. 3 - Magazines in Bookstores A survey of bookstores...Ch. 3 - Cost of Car Rentals A survey of car rental...Ch. 3 - AID: 1825 | 28/05/2018 16. Average Earnings of...Ch. 3 - Labor Charges The average labor charge for...Ch. 3 - Costs to Train Employees For a certain type of...Ch. 3 - Cost of a Mans Haircut The average cost of a mans...Ch. 3 - Exam Completion Time The mean time it takes a...Ch. 3 - Cases of Meningitis The data show the number of...Ch. 3 - Exam Grades Which of these exam grades has a...Ch. 3 - The number of police calls a small police...Ch. 3 - Printer Repairs The frequency distribution shows...Ch. 3 - Check each data set for outliers. a. 506, 511,...Ch. 3 - Check each data set for outliers. a. 14, 18, 27,...Ch. 3 - Named Storms The data show the number of named...Ch. 3 - Hours Worked The data shown here represent the...Ch. 3 - From the Data Bank, choose one of the following...Ch. 3 - Prob. 2DACh. 3 - Prob. 3DACh. 3 - Randomly select 10 values from the number of...Ch. 3 - Prob. 5DACh. 3 - AID: 1825 | 28/05/2018 Determine whether each...Ch. 3 - Prob. 2CQCh. 3 - Determine whether each statement is true or false....Ch. 3 - Prob. 4CQCh. 3 - In a data set, the mode will always be unique.Ch. 3 - Prob. 6CQCh. 3 - Determine whether each statement is true or false....Ch. 3 - Prob. 8CQCh. 3 - Determine whether each statement is true or false....Ch. 3 - Prob. 10CQCh. 3 - Prob. 11CQCh. 3 - Prob. 12CQCh. 3 - Which is not part of the five-number summary? a....Ch. 3 - A statistic that tells the number of standard...Ch. 3 - When a distribution is bell-shaped, approximately...Ch. 3 - Prob. 16CQCh. 3 - Generally, Greek letters are used to represent...Ch. 3 - Prob. 18CQCh. 3 - The symbol for the population standard deviation...Ch. 3 - When the sum of the lowest data value and the...Ch. 3 - If the mode is to the left of the median and the...Ch. 3 - An extremely high or extremely low data value is...Ch. 3 - Prob. 23CQCh. 3 - Prob. 24CQCh. 3 - Employee Years of Service In an advertisement, a...Ch. 3 - Newspapers for Sale The average number of...Ch. 3 - Prob. 27CQCh. 3 - Hours Worked The data shown here represent the...Ch. 3 - Prob. 29CQCh. 3 - Prob. 30CQCh. 3 - Exam Scores On a philosophy comprehensive exam,...Ch. 3 - Prob. 32CQCh. 3 - Prob. 1CTCCh. 3 - Ages of U.S. Residents The table shows the median...
Knowledge Booster
Background pattern image
Statistics
Learn more about
Need a deep-dive on the concept behind this application? Look no further. Learn more about this topic, statistics and related others by exploring similar questions and additional content below.
Recommended textbooks for you
Text book image
Glencoe Algebra 1, Student Edition, 9780079039897...
Algebra
ISBN:9780079039897
Author:Carter
Publisher:McGraw Hill
Text book image
Big Ideas Math A Bridge To Success Algebra 1: Stu...
Algebra
ISBN:9781680331141
Author:HOUGHTON MIFFLIN HARCOURT
Publisher:Houghton Mifflin Harcourt
Continuous Probability Distributions - Basic Introduction; Author: The Organic Chemistry Tutor;https://www.youtube.com/watch?v=QxqxdQ_g2uw;License: Standard YouTube License, CC-BY
Probability Density Function (p.d.f.) Finding k (Part 1) | ExamSolutions; Author: ExamSolutions;https://www.youtube.com/watch?v=RsuS2ehsTDM;License: Standard YouTube License, CC-BY
Find the value of k so that the Function is a Probability Density Function; Author: The Math Sorcerer;https://www.youtube.com/watch?v=QqoCZWrVnbA;License: Standard Youtube License